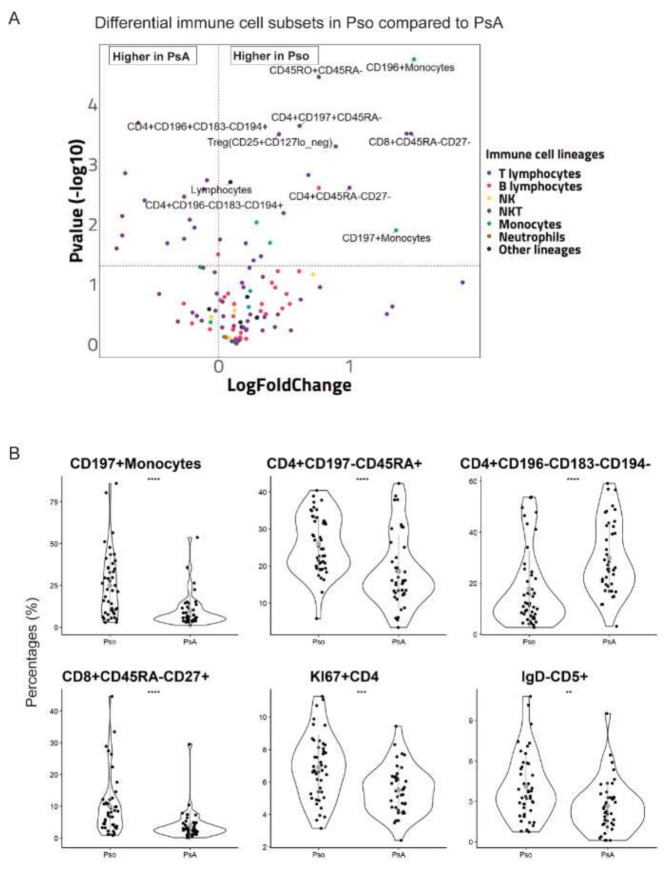
Figure 1.
Differences in the percentages of circulating immune cell subsets in PsA versus Pso. (A) The volcano plot shows the differential immune cell subsets in Pso versus PsA patients. Each dot represents one cell subset and is colored based on its lymphocytes lineage as indicated in the legend. The X-axis indicates the log2 (fold change of Pso/PsA). The horizontal dotted line indicates p = 0.05. The vertical dotted line indicates Pso/PsA fold change = 1. (B) The violin plots show examples of significantly different cell subsets in PsA versus Pso patients. Each dot represents an individual subject. The grey dot and grey line indicate the mean values and two times standard deviations, respectively.

