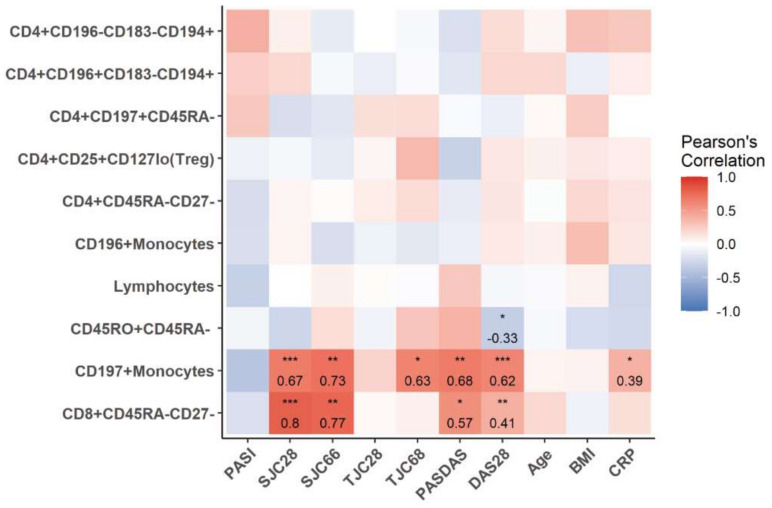
Figure 3.
Correlation of clinical parameters with key immune cell subsets that contribute to the discrimination of PsA and Pso. 1 Heatmap shows the Pearson′s correlation between percentages of top 10 PsA-classifying cell subsets with clinical parameters in PsA. Numbers indicate the Pearson’s correlation coefficient, * p < 0.05; ** p < 0.01; *** p < 0.001.

