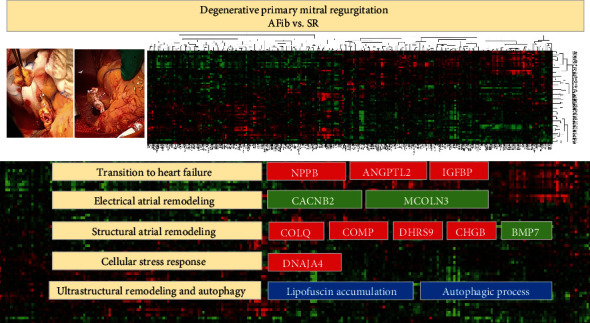
Figure 5.

Differentially expressed genes in LAA tissues of AFib vs. SR (fold change > 1.5; P < 0.05) and ultrastructural changes. As can be seen on the color bar, red indicates increased gene expression, and green indicates decreased gene expression.
