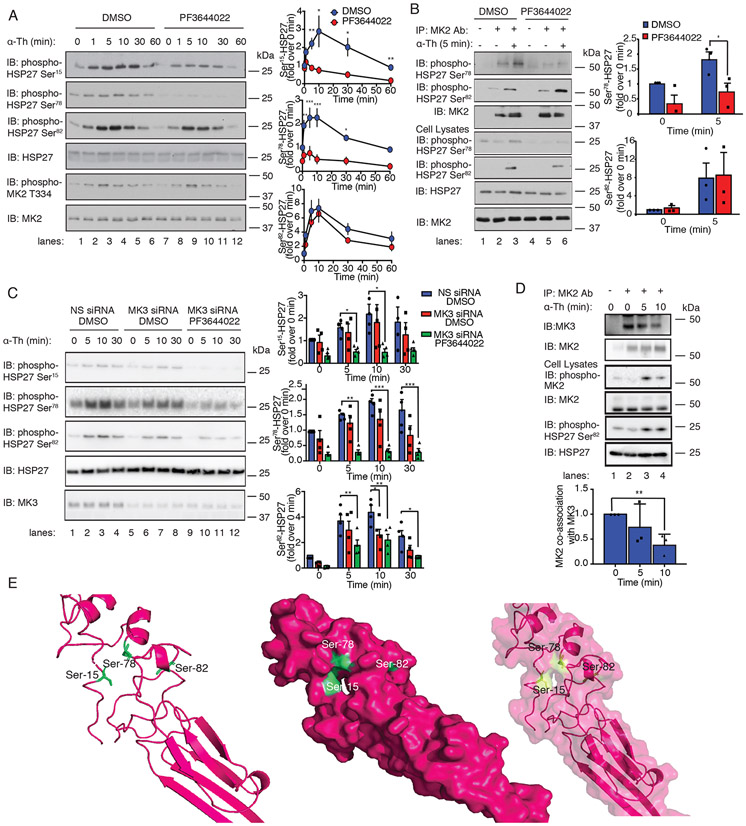
Fig. 4. MK2 and MK3 are required for thrombin-induced HSP27 phosphorylation.
(A) Left: Immunoblotting analysis of HSP27 and MK2 phosphorylation in HUVECs pretreated with 300 nM PF3644022 (MK2 inhibitor) or DMSO for 1 hour and stimulated with 10 nM thrombin (α-Th) for the indicated times. Blots are representative of four independent experiments. Right: Densitometric analysis of the fold-change in the relative abundances of the indicated phosphorylated proteins over time. Data are means ± SD of four independent experiments and were analyzed by Student’s t test. *P < 0.05; **P < 0.01; ***P < 0.001. (B) Left: In vitro assay of MK2 kinase activity. Immunoblot of HSP27 phosphorylation in HUVECs pretreated with PF3644022 or DMSO and stimulated with 10 nM α-Th. Cell lysates were analyzed by immunoblotting for HSP27 phosphorylation and MK2. Right: Data are means ± SD of four independent experiments and were analyzed by Student’s t test. *P < 0.05. (C) Left: Immunoblotting analysis of HSP27 phosphorylation in HUVECs transfected with MK3-specific or nonspecific (NS) siRNAs, pretreated with PF3644022 or DMSO, and stimulated with α-Th. Right: Densitometric analysis of the fold-change in the relative abundances of the indicated phosphorylated proteins over time. Data are means ± SD of four independent experiments and were analyzed by two-way ANOVA and Dunnett’s post-tests. *P < 0.05; **P < 0.01; ***P < 0.001. (D) Top: Immunoblotting analysis of MK2-MK3 co-immunoprecipitates from HUVECs stimulated with α-Th. Blots of HSP27 and MK2 phosphorylation are representative of three independent experiments. Bottom: Data are means ± SD of three independent experiments and were analyzed by Student’s t-test. **P < 0.01. (E) Phyre homology modeling of HSP27 residues Ser15, Ser78, and Ser82 within the predicted 3D structure. The three key serine residues are shown in green, and their positions are illustrated in ribbon (left), space-filled (middle), and merged (right) models.

