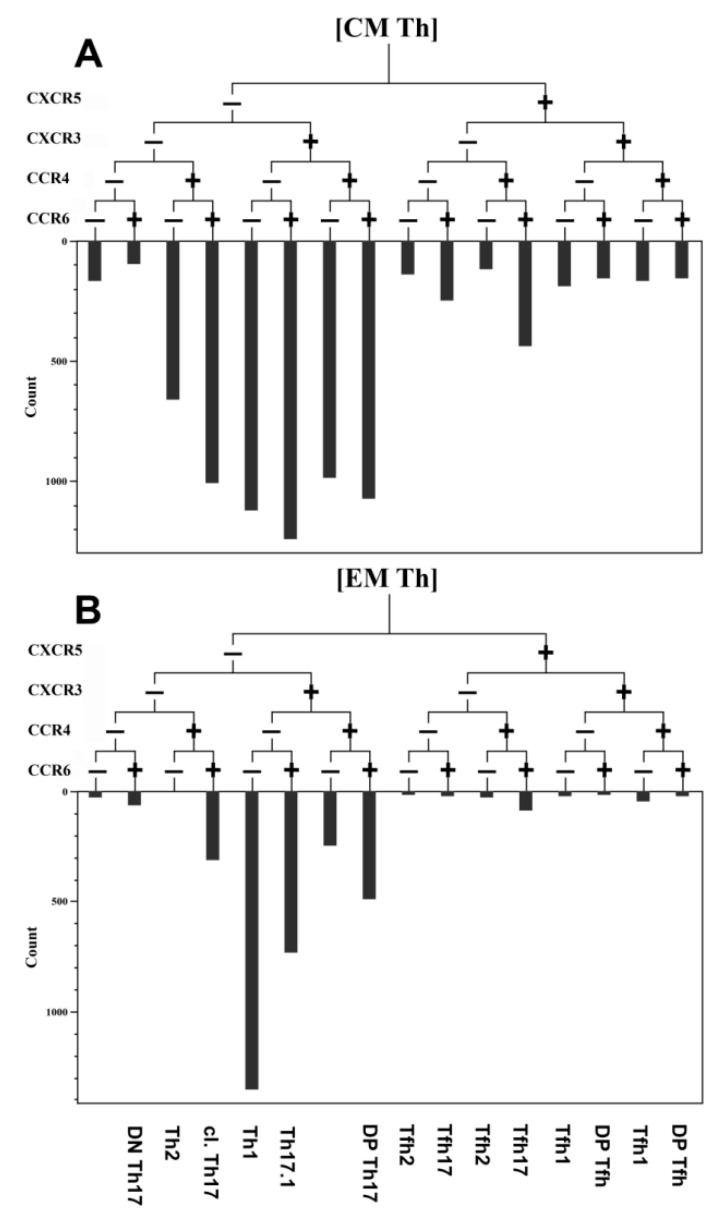
Figure 2.
An example of the relative distribution of CM and EM Th cells subsets according to their expression of CXCR5, CXCR3, CCR6, and CCR4 in the healthy donor. (A) Central memory Th cells (CM). (B) Effector memory Th cells (EM). The frequency histogram below the trees indicates the relative proportion of cells with different patterns of CXCR5, CXCR3, CCR6, and CCR4 and is based on their expression in Th-cell subsets.

