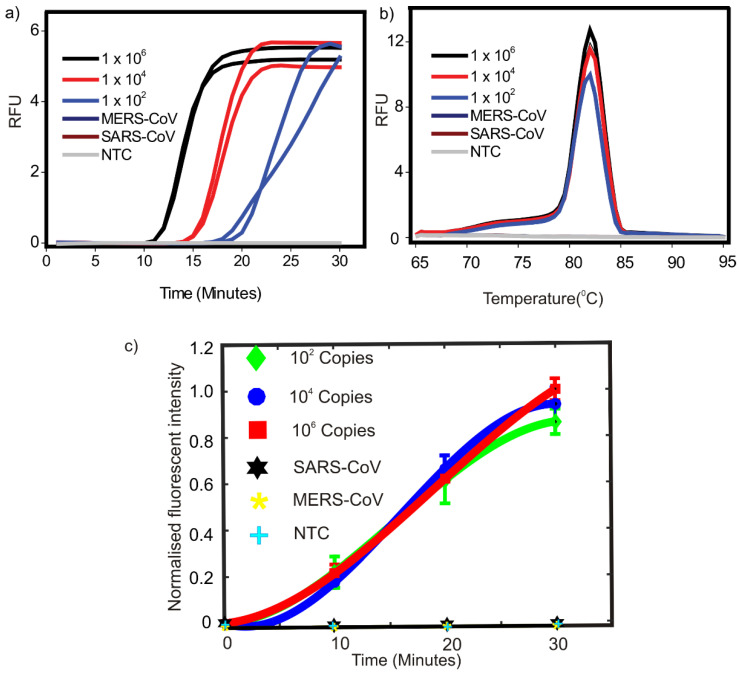
Figure 2.
(a) Amplification curves obtained for LAMP reactions carried out on conventional qPCR machine. (b) Corresponding melt peaks. For MERS-CoV and SARS-CoV controls see Section 2.1 for details. NTC = no-template control. (c) Variation of normalised fluorescent intensity of various samples with respect to time on performing the LAMP.

