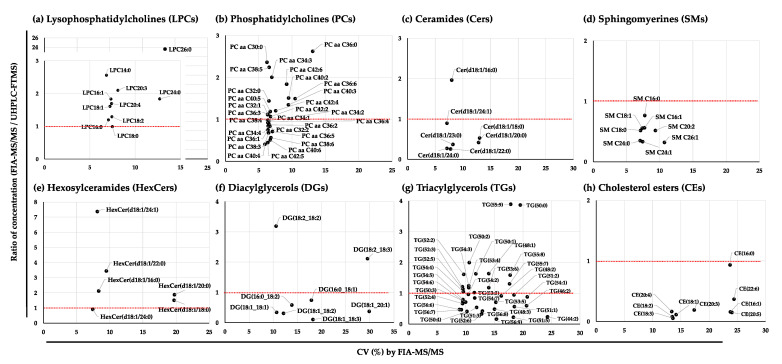
Figure 5.
Correlation plots of lipid species in the NIST plasma samples detected by UHPLC-FTMS and Kit-Met 2. (a) Lysophosphatidylcholines (LPCs); (b) phosphatidylcholines (PCs); (c) ceramides (Cers); (d) sphingomyelins (SMs); (e) hexosylceramides (HexCers); (f) diacylglycerols (DGs); (g) triacylglycerols (TGs); and (h) cholesterol esters (CEs). Metabolites were selected with a CV < 30% from 33 NIST plasma samples detected with Kit-Met 2. The correlation of concentrations was calculated by the ratio between the mean values of 33 NIST plasma samples detected by Kit-Met 2 and the mean values of 5 NIST plasma samples detected by UHPLC-FTMS. The red dotted line shows the 1.0 correlation of the ratio.

