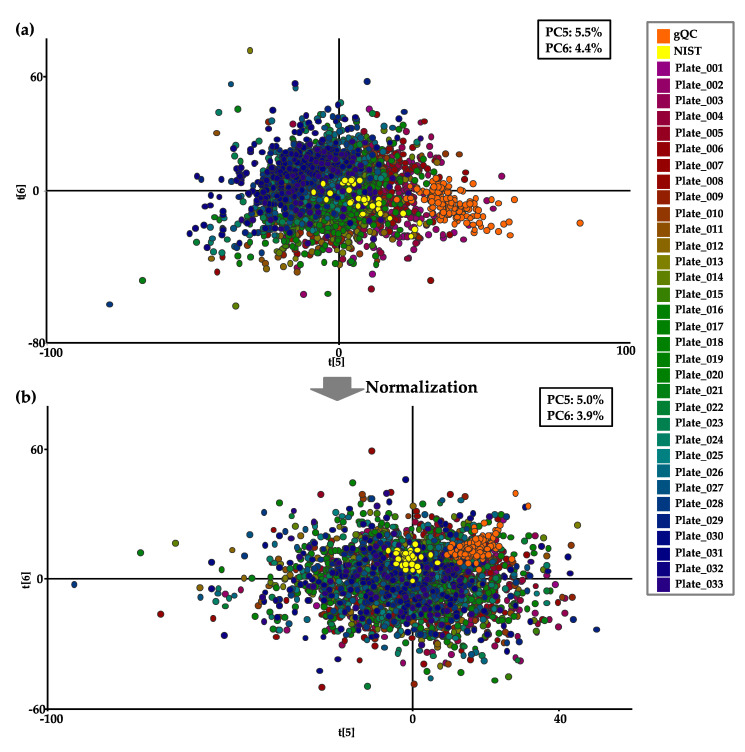
Figure 7.
Visualization of the interplate variation in the metabolites in the cohort of 2541 plasma samples with 33 NIST plasma samples and 132 gQC plasma samples detected by Kit-Met 2 on the PCA score plot before (a) and after (b) normalization by gQC. Samples are represented by dots color-coded for the 33 continuous plates. * The NIST and gQC plasma samples are represented as yellow and black dots, respectively.

