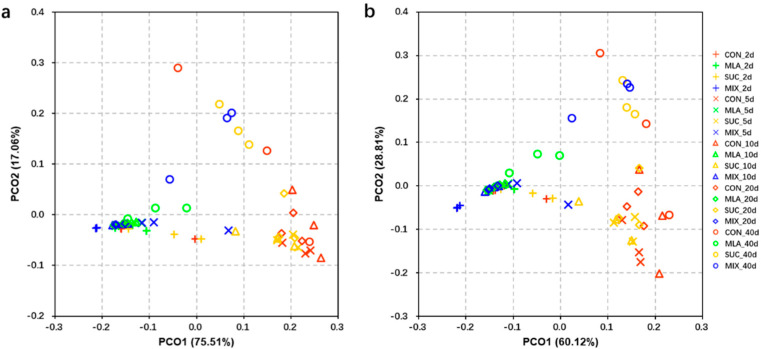
Figure 4.
Principal co-ordinates analysis (PCoA) plot of predicted functions (a) and pathways (b) of the bacterial communities analyzed via PICRUSt. CON, control group; MLA, 1% malic acid addition on the fresh weight (FW) basis; SUC, 1% sucrose addition on the FW basis; MIX, 1% malic acid and 1% sucrose addition on the FW basis.

