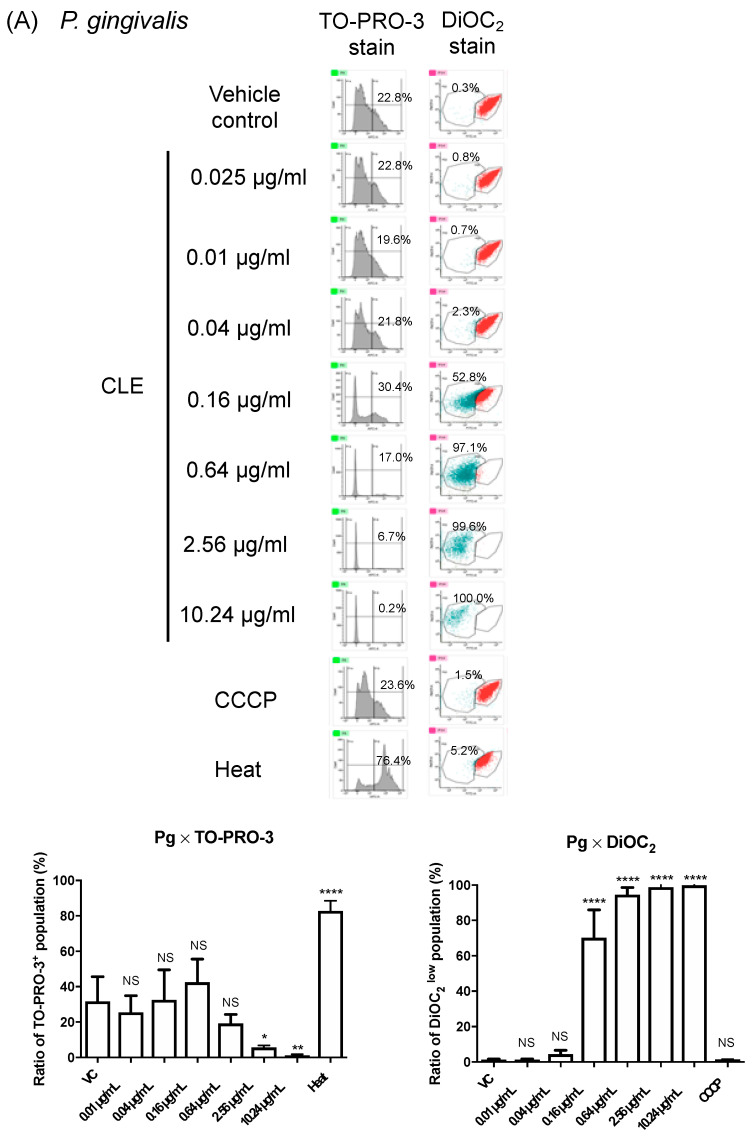
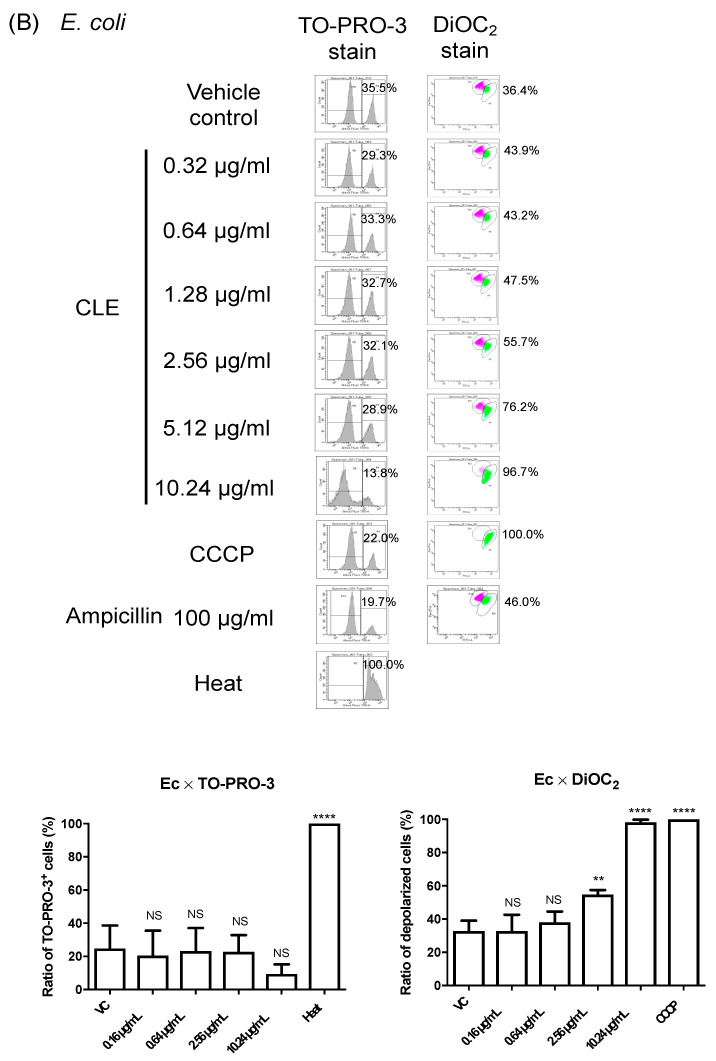
Figure 4.
Electrophysiological analysis of bacterial membranes treated with CLE. For FACS analysis, cells of P. gingivalis (A) and E. coli (B) were treated with CLE at different concentrations as indicated, then their membrane physiology was assessed using two different fluorescent dyes, TO-PRO-3 and DiOC2(3). P. gingivalis (A) and E. coli (B) cells were also subjected to heat treatment (Heat) or CCCP treatment (CCCP) as controls of cells with increased membrane permeability and depolarized cells, respectively. In (B), another sample was also exposed to ampicillin (as a representative of β-lactams). A representative FACS data are shown in the left panels of (A,B). In the upper right bar graphs of (A,B), the y-axis shows percentages of cells with increased membrane permeability (TO-PRO-3+) to total cells of P. gingivalis (A) and E. coli (B). In the lower right bar graphs of (A,B), the y-axis shows percentages of cells showing low fluorescent intensity of DiOC2 (DiOC2low) in P. gingivalis (A), and percentages of cells with membrane depolarization in E. coli (B). Data of the bar graphs are shown as the mean with SD of results obtained in three or four independent experiments in (A) or (B), respectively. NS: no statistical significance. * p ≤ 0.05, ** p ≤ 0.01, **** p ≤ 0.0001 (vs. vehicle control).


