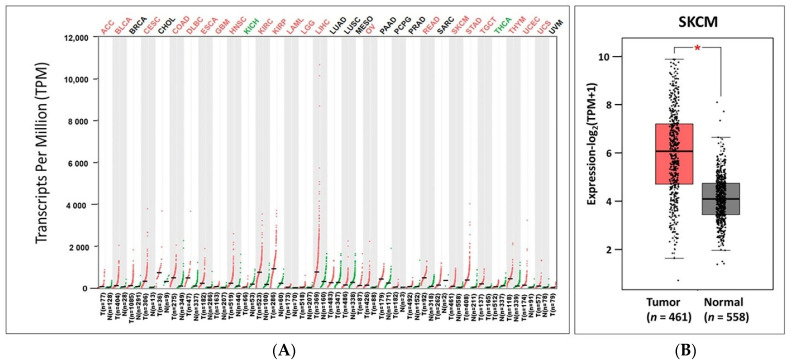
Figure 1.
IL32 mRNA expression levels in various types of cancers and their normal tissues. (A) Difference in IL32 expressions between tumor (red) and normal tissues (green) using the GEPIA2 database. Supplementary Table S2 presents the abbreviations of various types of cancers. (B) The box plots represent the IL32 mRNA expressions in SKCM (n = 461) and normal tissues (n = 558) using the GEPIA2. * p < 0.05.

