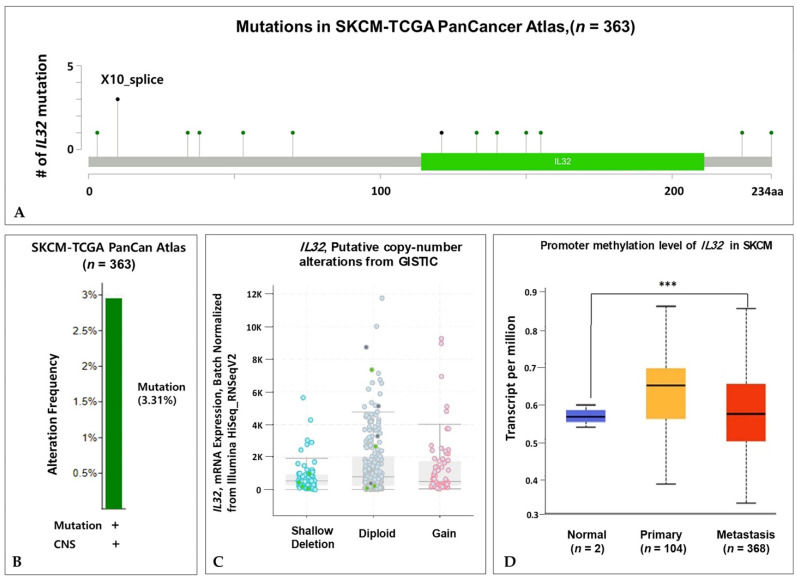
Figure 3.
Genome alterations and IL32 expression in SKCM. (A) The lollipop plot shows the type and location of each mutation frequency in the TCGA-SKCM PanCan Atlas dataset using the cBioPortal database (n = 363). (B) The mutations of the IL32 gene expression are presented in SKCM. (C) The correlation between IL32 expression and CNA status of shallow deletion (SD), diploid (D), and gain (G). (D) The box plots reveal the promoter methylation levels of IL32 in the TCGA-SKCM dataset using the UALCAN database. Normal vs. Primary (p = 4.23 × 10⁻¹), Normal vs. Metastasis (p = 5.95 × 10⁻⁵), and Primary vs. Metastasis (p = 9.15 × 10⁻¹); *** p < 0.001.

