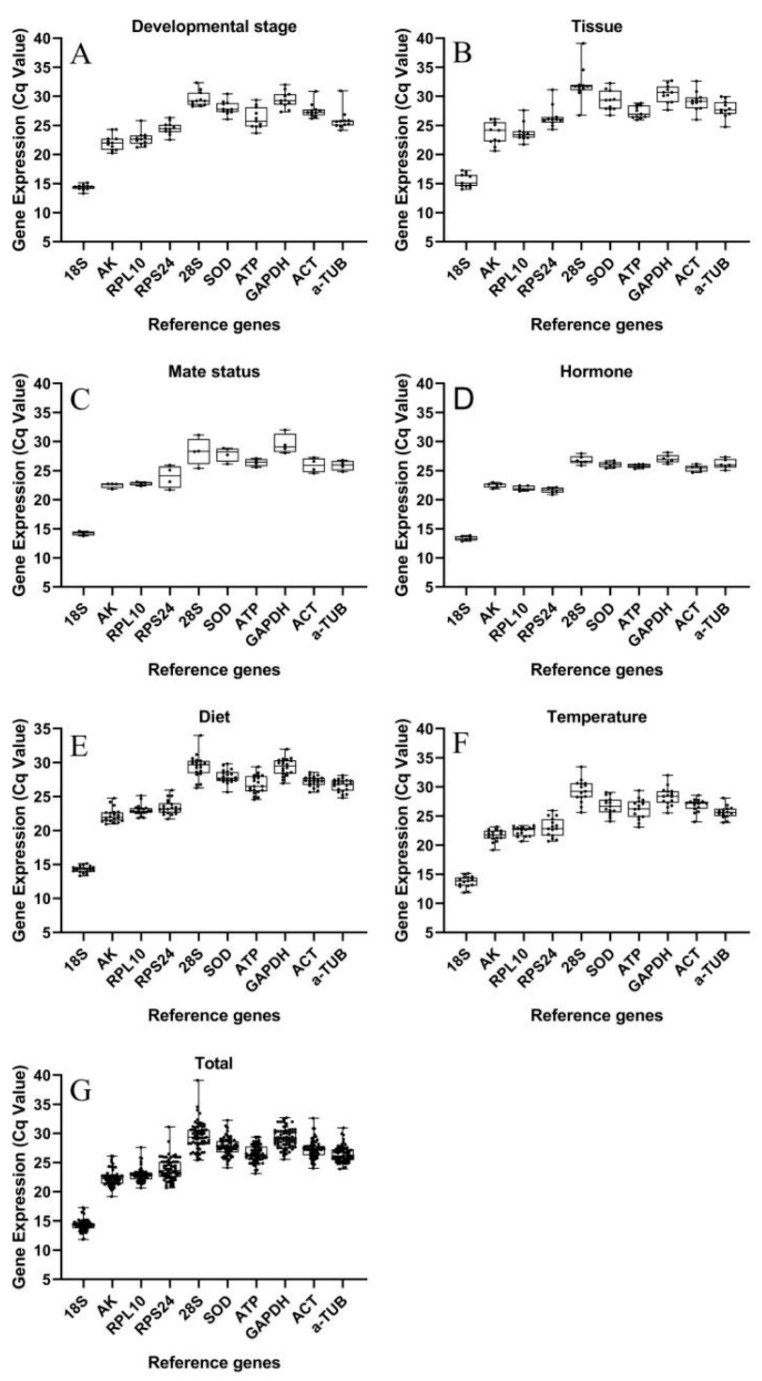
Figure 1.
Expression profiles of 10 candidate reference genes of S. frugiperda in different treatments. (A) different developmental stages (n = 33); (B) various tissues (n = 33); (C) mating status (n = 12); (D) hormone treatment (n = 18); (E) diets treatment (n = 60); (F) temperature treatment (n = 45); (G) all samples (n = 201); the Ct values indicate the expression levels of reference genes and n represents the number of samples used to derive values; the box represents the 25th to 75th percentiles and the line in the box represents the median, and the bars represents the minimum and maximum.

