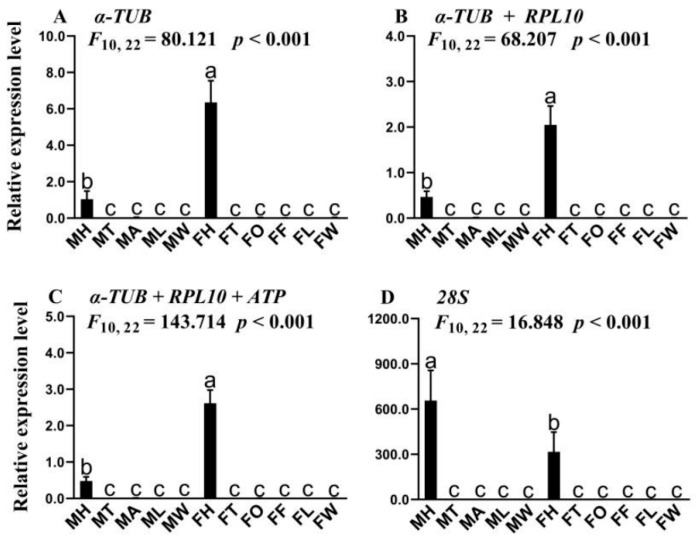
Figure 4.
Expression level of SfruOBP1 in various tissues of S. frugiperda. MH: male head, MT: male thorax, MA: male abdomen, ML: male leg, MW: male wing; FH: female head, FT: female thorax, FO: female ovary, FF: female fat body, FL: female leg, FW: female wing. Relative expression levels of OBP1 were normalized with (A): α-TUB (most stable reference gene), (B): α-TUB and RPL10 (the two most stable reference genes), (C): α-TUB, RPL10, and ATP (optimal combination of reference genes) and (D): 28S (least stable reference gene). The data in the figures are means ± SE. Means are from three biological replicates. Different letters above bars indicate significant differences (p < 0.05, one-way ANOVA analysis followed by Tukey’s test).

