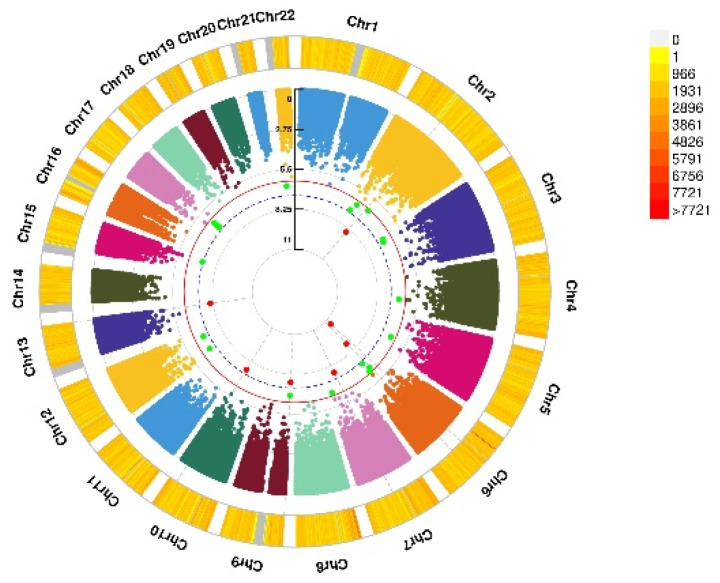
Figure 3.
Genomic regions interacting with VD PRS before COJO adjustment for GAD score. This graph shows 7 independent SNP alleles interacting significantly with blood VD in anxiety disorders (GAD score). From the center, the first circos depicts the −log10 p-values of each variant due to double exposure, i.e., the effect of both SNP allele and VD PRS before COJO adjustment. The second circos shows chromosome density. Red dots represent the p < 5 × 10⁻⁸ and green dots represent p < 1 × 10⁻⁷. The figure was generated using the “CMplot” R script (https://github.com/YinLiLin/R-CMplot) (accessed on 15 February 2021).

