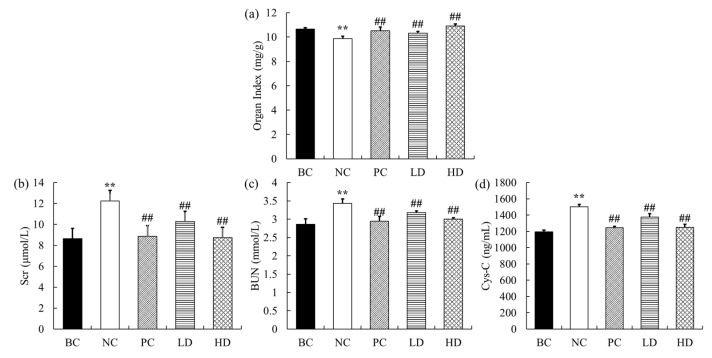
Figure 2.
Effect of UPE on organ index and serum Scr, BUN, and Cys-C levels. (a) Organ index. (b) Scr content. (c) BUN content. (d) Cys-C content. The data are expressed as mean ± standard deviation (n = 9). ** p < 0.01 compared with BC group; ## p < 0.01 compared with NC group. BC: blank control, NC: negative control, PC: positive control, LD: low-dose UPE (50 mg/kg), HD: high-dose UPE (300 mg/kg).

