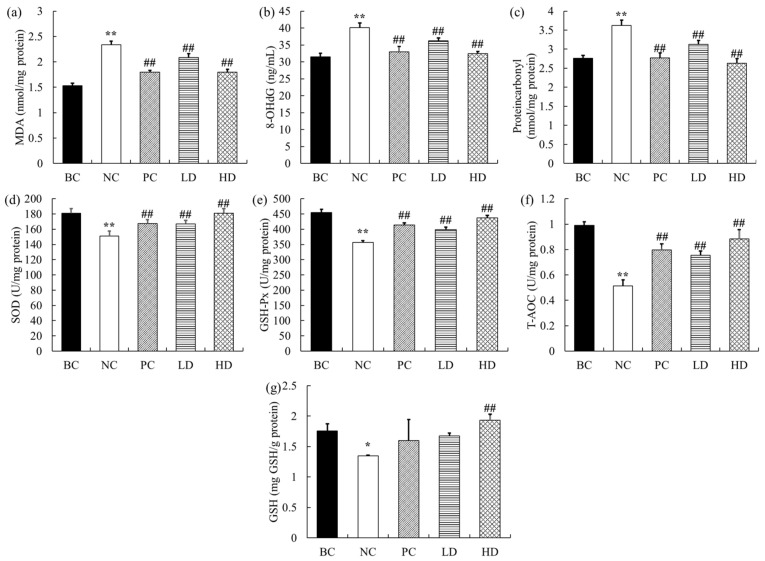
Figure 3.
Levels of antioxidant indexes in the kidney of mice. (a) MDA content. (b) 8-OHdG concentration. (c) Protein carbonyl content. (d) SOD activity. (e) GSH-Px activity. (f) T-AOC activity. (g) GSH content. Data are presented as mean ± standard deviation (n = 9). * p < 0.05, ** p < 0.01 compared with BC group; ## p < 0.01 compared with NC group. BC: blank control, NC: negative control, PC: positive control, LD: low-dose UPE (50 mg/kg), HD: high-dose UPE (300 mg/kg).

