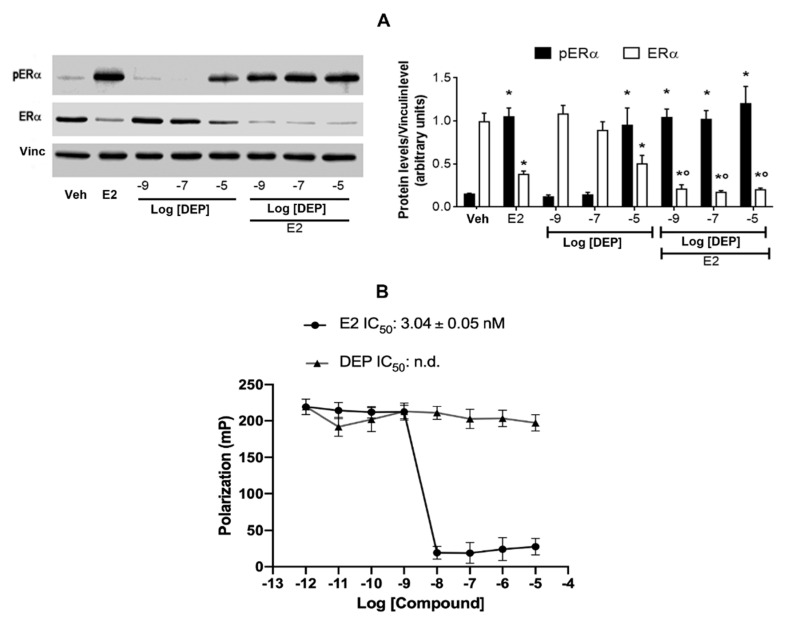
Figure 1.
ERα activation and in vitro binding assays. Western blot (left panel) and corresponding densitometric analysis (right panel) of Ser118-phosphorylated ERα and total ERα protein level in MCF-7 treated for 1 h with the endogenous ERα ligand E2 (10−8 M) as positive control, and a dose curve of DEP at 10−9, 10−7, and 10−5 M in the presence or absence of E2 co-treatment (A). The vinculin levels were used as an internal control of protein loading. Data are means ± SD of at least four experiments. p < 0.01 was determined by the ANOVA test followed by the Bonferroni post-test vs. Veh (*) and E2 (°). In vitro ERα competitive binding assay for the endogenous ligand E2 and DEP performed over the 10−12–10−5 M range by using fluorescent E2 as a tracer. Inhibitor concentration (IC50- nM) is indicated in the panel for each compound (B).

