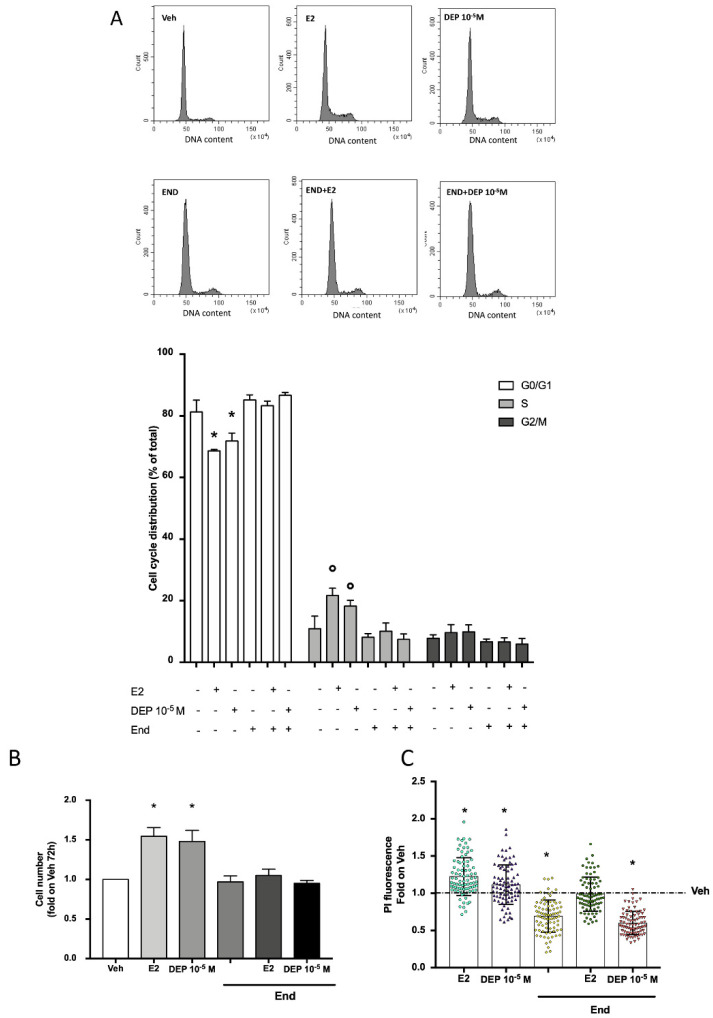
Figure 4.
The effect of DEP on ERα-dependent DNA synthesis, cell cycle progression, and proliferation. Cell cycle analysis in MCF-7 cells treated with DEP 10−5 M for 24 h with or without pre-stimulation with End (10−6 M, 1 h before). Upper panels show flow cytometry analysis for cell cycle distribution of MCF-7 cells under different treatment conditions. The bottom panel shows the percentage of cells in G0/G1, S, and G2/M phases with respect to different stimulations. Histograms are representative of at least three independent experiments (A). Viable cell number (B) and analysis of total DNA content obtained from propidium iodide (PI) assay (B) of MCF-7 cells treated with DEP 10−5 M for 72 h in the presence or absence of End pre-treatment (10−6 M, 1 h before). Data are shown as fold of increase in Vehicle condition represented by the blank column (B) or as the dotted line (C). E2 stimulation with or without End pre-stimulation was used as positive control. p < 0.01 was determined by the ANOVA test followed by the Bonferroni post-test vs. G0/G1 phase Veh (-,-,-) and Veh (B,C) (*) or vs. S phase Veh (-,-,-) (°).

