Figure 3.
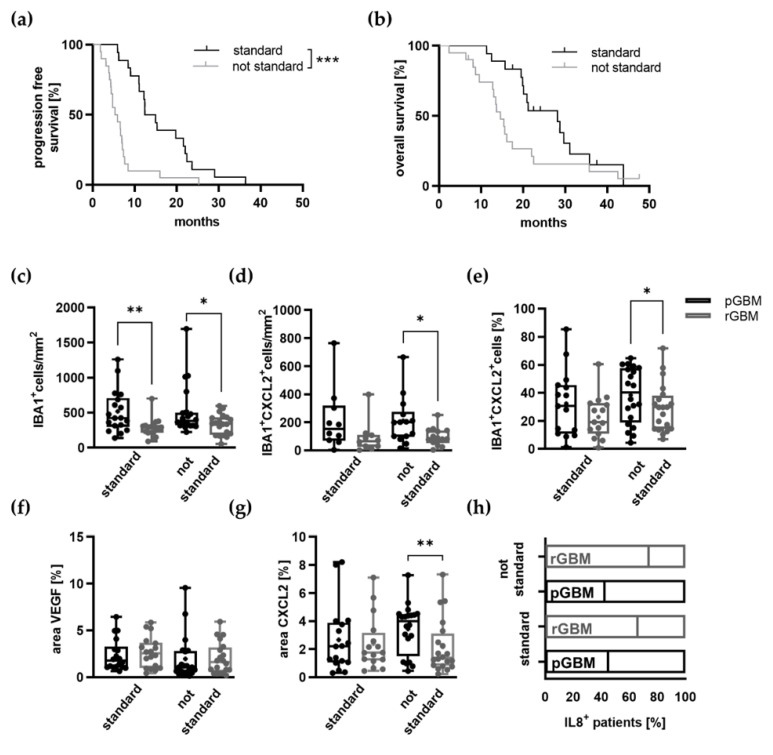
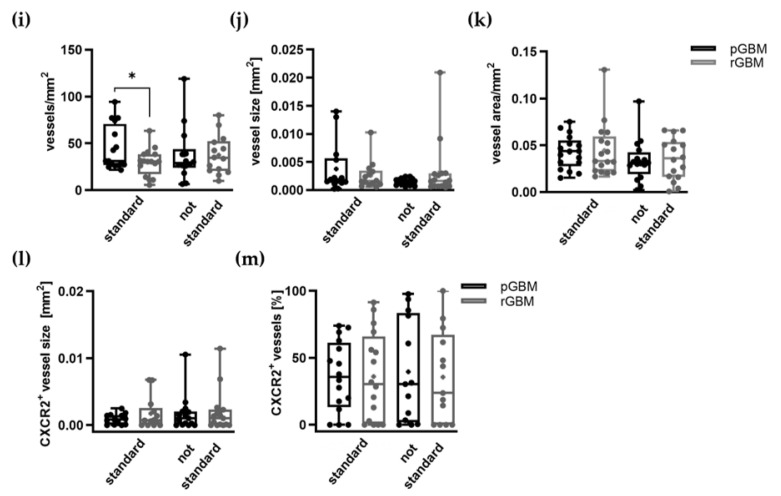
Influence of TMZ on TAM infiltration, tumor vascularization, and expression of proangiogenic molecules in matched primary and recurrent GBMs. (a,b) Kaplan–Meier curves for (a) progression-free (PFS) and (b) overall survival (OS) of the subgroup analysis comparing the standard with the not standard group. (c–m) Graphs show the calculation of the stained area of TAMs (IBA1) (c–e), proangiogenic molecules VEGF (f), CXCL2 (g), IL8 (h) tumor vessels (CD31) (i–k), and CXCR2+ vessels (l,m) on FFPE tissue sections of primary and recurrent tumors of all patients. (c) Graph depicts the amount of TAMs in primary and recurrent tumors of both groups, which were significantly reduced in recurrent tumors (standard: mean difference: 246.7; 95% confidence interval −400.5 to −92.87; not standard: mean difference: −192.2; 95% confidence interval −370.0 to −14.40). (d,e) Graphs depict CXCL2+ TAMs in primary and recurrent tumors of both groups. (f–h) Graphs show calculation of the stained area of VEGF (f) and CXCL2 (g) (n = 38; standard: n = 18; not standard: n = 20). (h) The number of IL8+ patients in primary and recurrent tumors was calculated (n = 38; standard: n = 18; not standard: n = 20). (i–k) Graphs depict vessels/mm2 (i), the vessel area/vessel number (j), and vessel area/mm2 (k) (n = 30; standard: n = 15; not standard: n = 15). (l,m). The area of CXCR2+ vessels/CXCR2+ vessel number in (l) and the percentage of CXCR2+ vessels in relation to all vessels (m) was calculated (n = 28; standard: n = 13; not standard: n = 15). * p < 0.05, ** p < 0.01, *** p < 0.001. (c–m) paired Student’s t-test; box plots depicting mean (shown as “+”), median, 1st and 3rd quartile (shown as the box) and min to max (shown as the whiskers).


