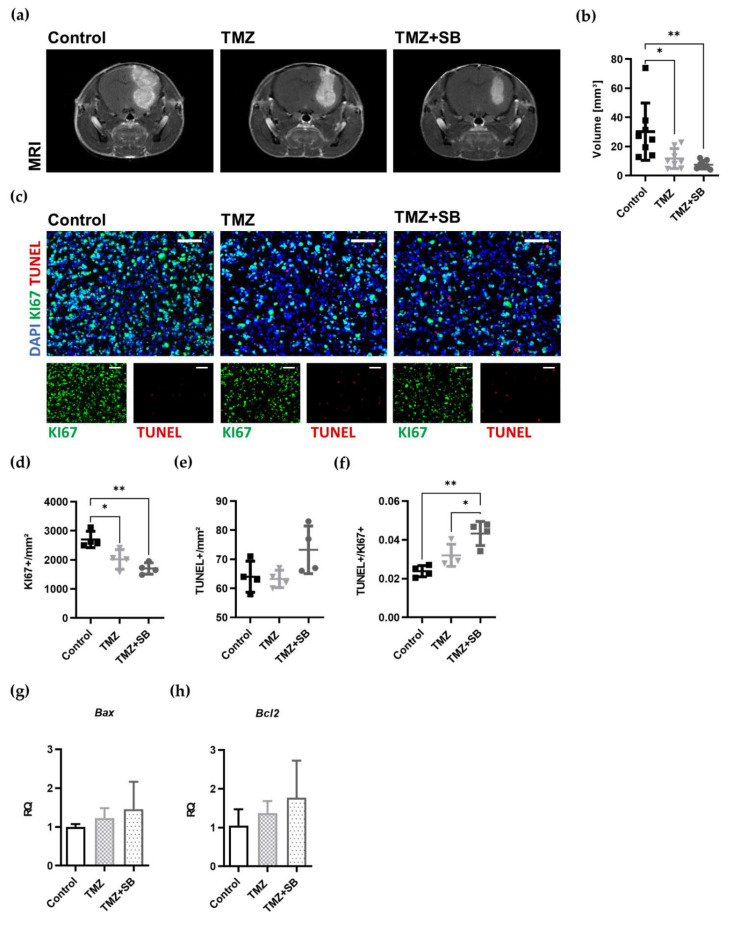
Figure 4.
Post treatment MRIs of tumor volume and therapy-induced effects on proliferation and apoptosis. (a) Representative T1w MRI images after contrast agent administration are showing a therapy-induced reduction of tumor volume after the treatment with TMZ and TMZ + SB. (b) Quantitative tumor volumetry showed a significantly reduced tumor volume by 75% in the combination group (TMZ + SB) whereas TMZ alone reduced tumor volume by 61% (n = 7–8; * p = 0.0224; ** p = 0.0062). (c) Representative immunofluorescence staining of each group showing a reduction of proliferation in the TMZ and TMZ + SB group while apoptosis seemed to be unaffected (Ki67: green, TUNEL: red, scale bar = 100 µm). (d) The detailed analysis of proliferation showed significant impairment in both treatment groups. The proliferation was reduced by 37% in the combination group and 25% in the TMZ group (n = 4; * p = 0.0205; ** p = 0.002; TMZ vs. TMZ + SB, p = 0.4416). (e) However, apoptosis remained unaltered (n = 4; Control vs. TMZ, p = >0.9999; Control vs. TMZ + SB, p = 0.1616; TMZ vs. TMZ + SB, p = 0.1204). (f) If the ratio of apoptosis and proliferation was calculated, a significant shift towards apoptosis could be detected only in the combination group of TMZ + SB225002 (n = 4; * p = 0.0388; ** p = 0.0014). (g,h) Apoptosis-regulating molecules Bax (proapoptotic) and Bcl2 (antiapoptotic) were unchanged in qRT-PCR analysis (n = 3–4). (d–f) Graphs depict individual values with additional mean ± standard deviation; bar graphs (g,h) showing mean ± standard deviation. One-way ANOVA with Bonferroni correction was performed in all analyses.

