Figure 5.
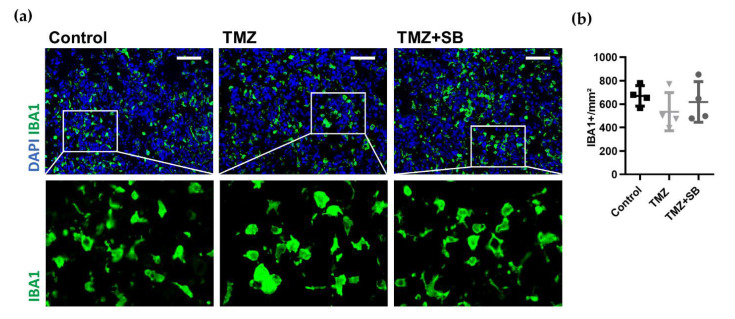
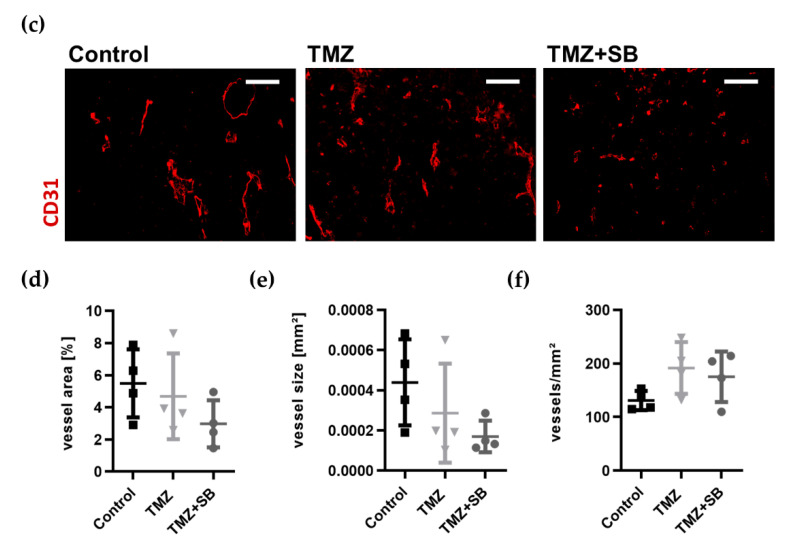
Therapy-induced effects on TAM accumulation and tumor vascularization. (a) Representative immunofluorescence staining showing no differences in TAM accumulation between groups (DAPI: blue, IBA1: green, scale bar = 100 µm). Additionally, no obvious changes in TAM morphology by therapy were observed as indicated in the magnified images. (b) The quantitative analysis of TAM accumulation showed comparable levels between all groups. (c) Representative immunofluorescence staining showing a tendency of diminished tumor vascularization (CD31: red, scale bar = 100 µm). (d–f) Quantitative comparison of vessel parameters showed reduced vessel area (calculated as a percentage in relation to the total analyzed tumor area; n = 4; Control vs. TMZ, p ≥ 0.9999; Control vs. TMZ + SB, p = 0.3951; TMZ vs. TMZ + SB, p = 0.8661) and average vessel size (calculated as total vessel area/vessel number; n = 4; Control vs. TMZ, p = 0.8802; Control vs. TMZ + SB, p = 0.2449; TMZ vs. TMZ + SB, p ≥ 0.9999) which was most markedly in the combination group. Vessel density was unchanged in all groups (n = 4; Control vs. TMZ, p = 0.1841; Control vs. TMZ + SB, p = 0.4623; TMZ vs. TMZ + SB, p ≥ 0.9999). Graphs depict individual values with additional mean ± standard deviation. One-way ANOVA with Bonferroni correction was performed in all analyses.


