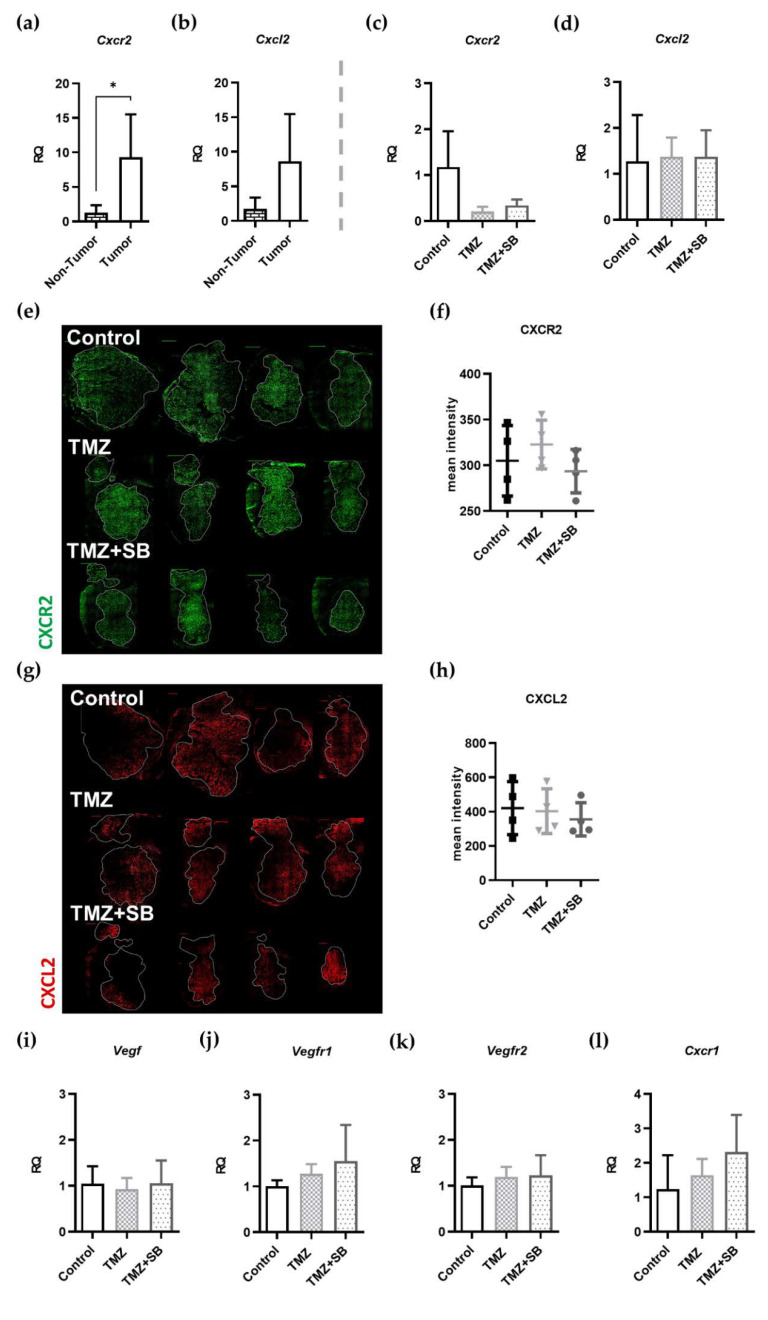
Figure 6.
Upregulation of CXCL2/CXCR2 signaling in tumor tissue and the influence of therapy on CXCR2 signaling and alternative pathways. (a) Gene expression of Cxcr2 was significantly upregulated (7-fold) in tumor tissue of GL261 mouse GBMs compared to contralateral brain parenchyma (n = 4; p = 0.0434). (b) Additionally, Cxcl2 was upregulated 5-fold but did not a significant level in this study (n = 4; p = 0.0977). (c) The investigation of Cxcr2 showed a therapy-induced decrease of gene expression under TMZ and TMZ + SB treatment (n = 3–4, Control vs. TMZ, p = 0.0693; Control vs. TMZ + SB p = 0.1637) but without reaching statistical significance. (d) However, Cxcl2 remained completely unchanged (n = 3–4). (e–h) Representative immunofluorescence staining of CXCR2 and CXCL2 on the protein level showed no differences or group-specific distribution patterns amongst all groups (CXCR2: green, CXCL2: red). The measurement of the mean intensity of immunofluorescence images of both molecules showed no differences of protein expression. All images were captured with the same exposure time under comparable conditions (n = 4). (i–k) qRT-PCR analysis of the classic angiogenic pathway with Vegf and its receptors Vegfr1 and Vegfr2 showed no compensatory upregulation during therapy with TMZ or TMZ + SB (n = 3–4). (l) Gene expression of Cxcr1, which has similar downstream effects as Cxcr2, was also not altered significantly (n = 3–4). (a–d,i–l) Bar graphs showing mean ± standard deviation; (f,h) graphs depict individual values with additional mean ± standard deviation; one-way ANOVA with Bonferroni correction was performed in all analyses.

