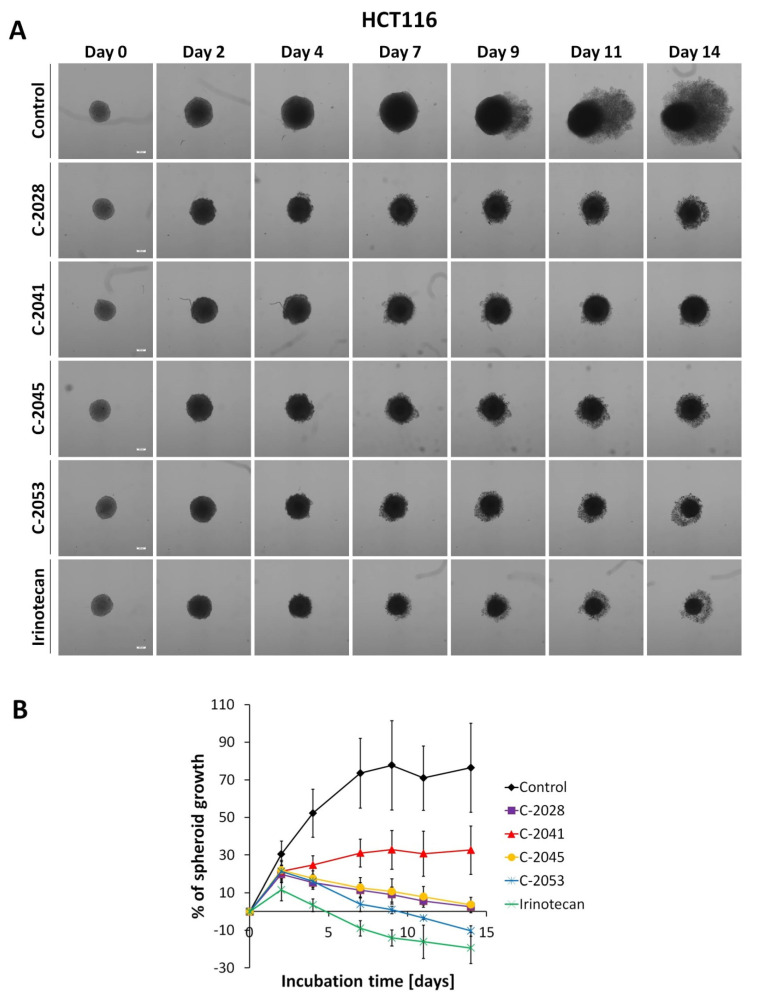
Figure 2.
HCT116 spheroid morphology and kinetics. Spheroids were incubated with UAs at concentrations corresponding to IC90 values and irinotecan at an IC50 dose for 14 days. Every 2–3 days, images of the spheroids were taken and diameters were measured. (A) Representative images of the HCT116 control spheroids and spheroids treated with tested compounds. (B) Growth kinetics presented in a graph as percentages of spheroid growth over time. Data represent the averages of four independent experiments with standard deviation. White scale bars presented on images taken on day 0 correspond to 200 µm.

