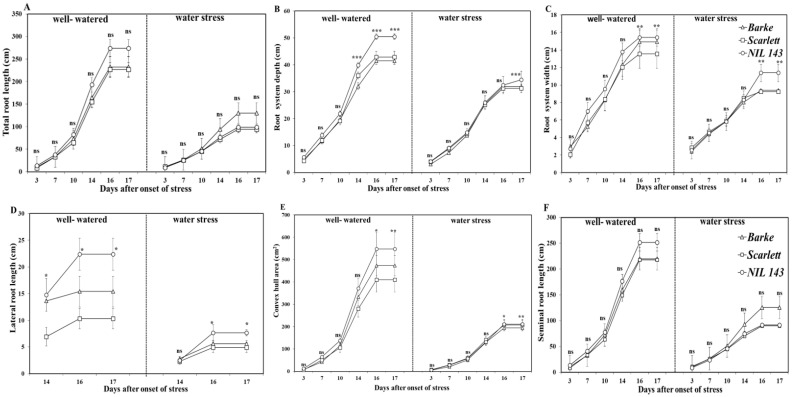
Figure 2.
Visible root system growth at the seedling stage over time among the different barley genotypes under well-watered and water stress in rhizoboxes. Plotted are the means fitted with the standard error, n = 6. Significant differences (α = 0.05) among genotypes and treatments at specific days after stress are indicated with asterisks *, **, ***, which follow the standard probability values of 0.05, 0.01, and 0.001, respectively. In the panel: (A)—total root length; (B)—root system depth; (C)—root system width; (D)—lateral root length; (E)—convex hull area; and (F)—seminal root length.

