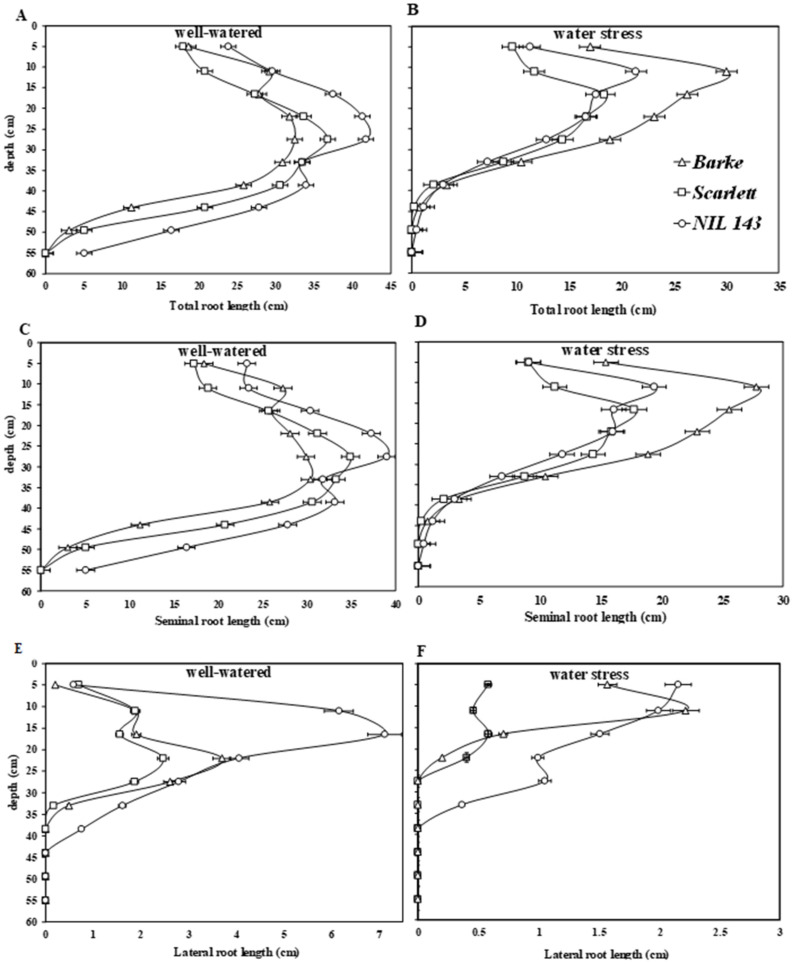
Figure 3.
Visible root system placement along the soil profile (0–55 cm) in rhizoboxes for the different genotypes under WW and WS conditions 17 days after the onset of stress. In the panel: (A)—visible total root length under well-watered; (B)—visible total root length under water stress; (C)—visible seminal root length under well-watered; (D)—visible seminal root length under water stress conditions; (E)—Visible lateral root length under well-watered; and (F)—visible lateral root length under water stress conditions. Each point represents root growth averaged among six rhizoboxes per treatment (n = 6). Bars on top are standard errors.

