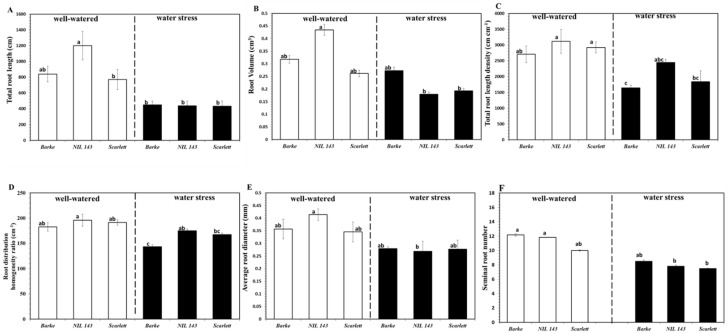
Figure 4.
Root architectural traits of the different barley genotypes 17 days after the start of the experiment under well-watered and water stress treatments in rhizoboxes. In the panel are: (A)—total root length; (B)—root volume; (C)—total root length density, (D)—root distribution homogeneity ratio; (E)—average root diameter; and (F)—seminal root number. Plotted are the means and their respective standard error. Different letters on the bars denote significant differences (α = 0.05) based on Tukey’s post hoc test for pair-wise comparison, n = 6.

