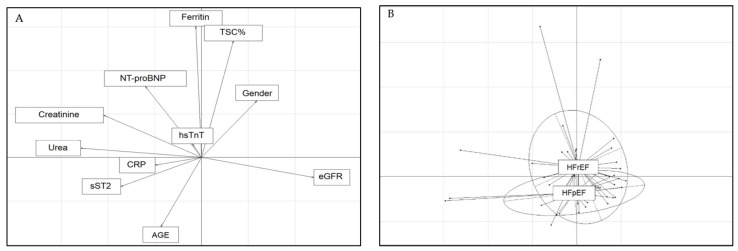
Figure 1.
Arrow (A) and class (B) plots for clinical and biochemical metrics. (A) Arrow plot for clinical and biochemical metrics as a projection on two axes of the whole metrics used in the prediction model. (B) Class plot showed the same axis set-up but with the projection of the two respective HF groups of patients.

