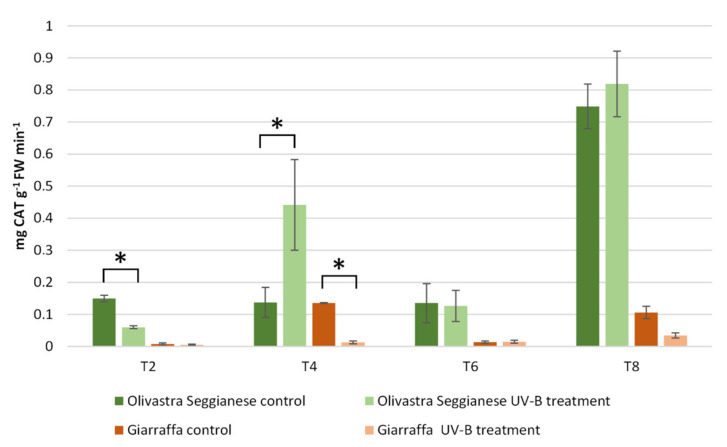
Figure 3.
Catalase activity in Giarraffa and Olivastra Seggianese leaves under control conditions and after exposure to UV-B treatment. The X-axis indicates the treatment times. The asterisks (*) indicate statistically significant differences between control and stressed samples within each variety. The two varieties differ by ANOVA test for p ≤ 0.01. Values are mean ± standard (n = 6).

