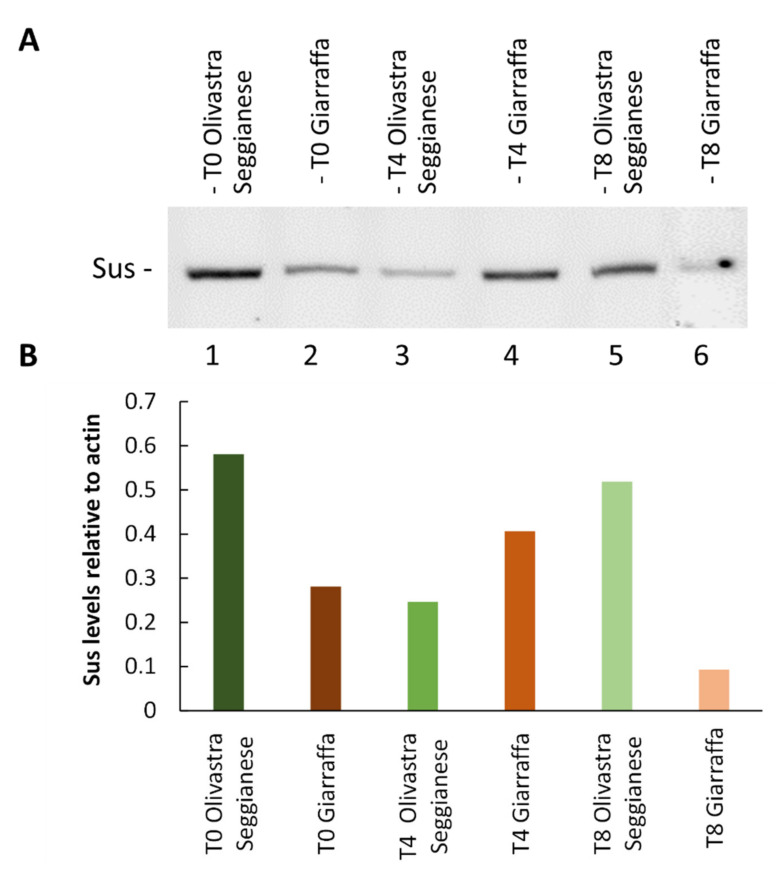
Figure 9.
Analysis of sucrose synthase content. (A) Electrophoresis and immunoblotting with anti-sucrose synthase antibody on proteins extracted from Giarraffa and Olivastra Seggianese plants, subjected to UV-B stress and collected at T0, T4, and T8. Lane 1: Olivastra Seggianese at T0. Lane 2: Giarraffa at T0. Lane 3: Olivastra Seggianese at T4. Lane 4: Giarraffa at T4. Lane 5: Olivastra Seggianese at T8. Lane 6: Giarraffa at T8. (B) Graph of the relative quantification of immunoblot intensities for sucrose synthase relative to the actin content.

