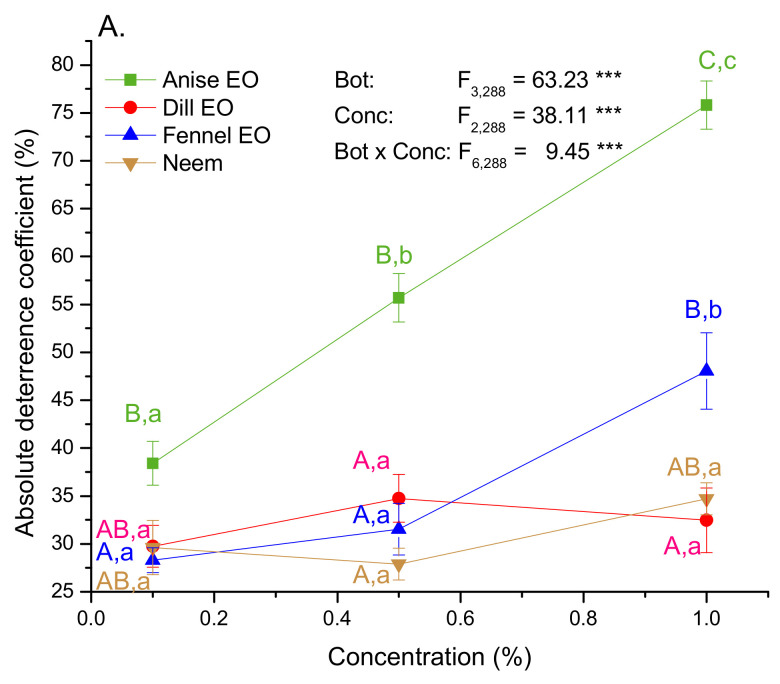
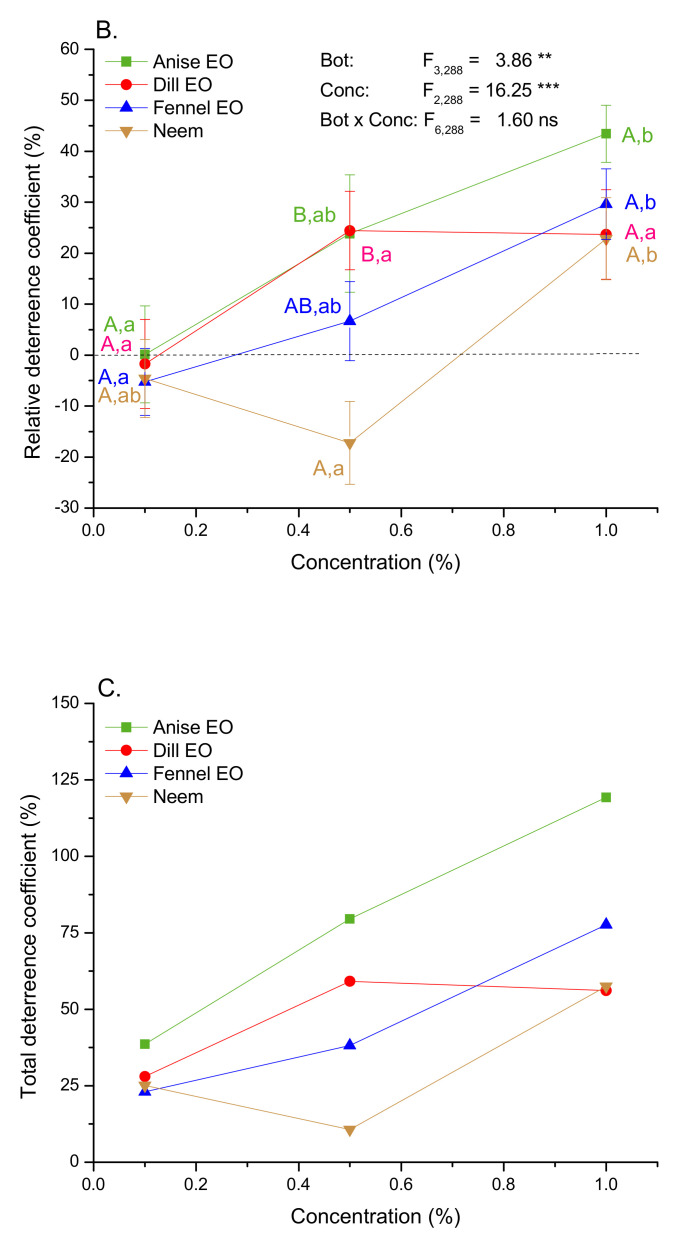
Figure 1.
Absolute (A), relative (B) and total (C) deterrence coefficient (mean ± SE) in the 2nd instar GML. F-values were obtained from two-way ANOVA testing significance of the main (botanical type−Bot and concentration−Conc) and interaction (Bot × Conc) effects on analyzed traits (** p ˂ 0.01, *** p ˂ 0.001). Different colored letters mark significant differences among EOs and neem within each concentration (capital letters A, B, C), and among concentrations within each EO and neem (small letters a, b, c) (LSM contrasts, p ˂ 0.05).


