Figure 2.
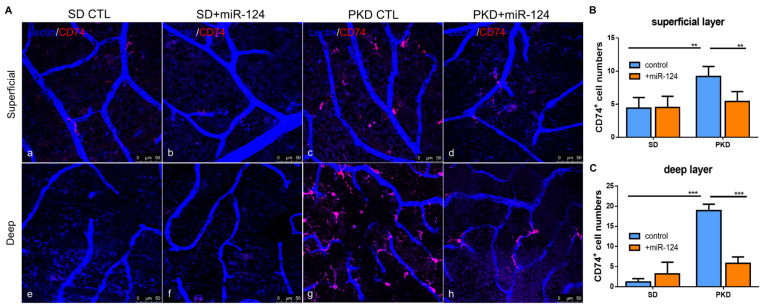
Microglial distribution and activation in SD and PKD retinae, with whole-mount immunofluorescent staining of CD74 in retinae from SD (a,b,e,f) and PKD (c,d,g,h) rats treated with either control miRNA (CTL) (a,c,e,g) or an miR-124 mimic (miR-124) (b,d,f,h). Microglia were labeled with CD74 (red). Retinal vessels were labeled with iso-lectin B4 (blue). (A) Representative images of microglial activation (CD74+) in the superficial layer (upper panel) and in the deep layer (lower panel). (B) Quantification of the CD74+ microglia in the superficial layer (upper panel A). (C) Quantification of the CD74+ microglia in the deep layer (lower panel A). The images were taken with a Leica confocal microscope TCS SP8 with scale bars = 50 µm. Data (B,C) are exhibited as means ± SD, n = 5. The p values were determined by two-way ANOVA with Tukey’s multiple comparisons test were ** p < 0.01 and *** p < 0.001.

