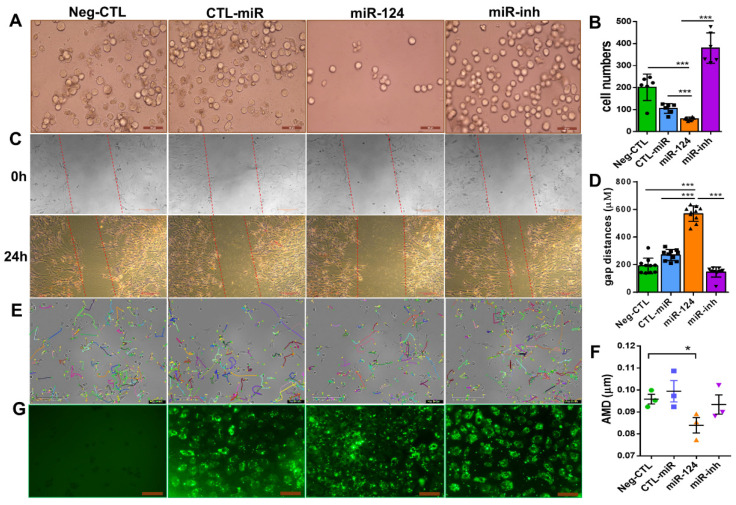
Figure 5.
miR-124 reduced microglial cell motility. BV2 microglial cells (A,E,G) and rat primary microglial cells (C) were transfected with Lipofectamine 2000 Transfection Reagent as a negative control (Neg-CTL), control microRNA (CTL-miR), microRNA-124 (miR-124), and miR-124 inhibitor (miR-inh) for 24 h (A,C,E,G). (A) Images of transwell migration assays taken with a Zeiss Axio Observer Z1 microscope, where the scale bars = 50 µm. (B) Quantification showed that the migrating cells moved downward well with the serum-free medium after 24 h. (C) Images of wound healing assays with rat primary microglial cells at time point 0 h (upper panel) and end time point 24 h (low panel), with scale bars = 200 µm. (D) Quantification of the gap sizes from the 24 h-panel of (C). (E) Tracking of single BV2 cell movement. After 24 h of transfection, cells were applied to live cell imaging with an Incucyte S3 phase contrast microscope. Images of three fields per well were taken at 30-min intervals, and cell tracking was monitored for 10 h. Tracks of individual cells are shown in different colors, where the scale bars = 200 µm. (F) Quantification of the average migration distance (AMD in µm) of a single cell was analyzed with the TimeLapse Analyzer (TLA). Three fields each of 100 cells were analyzed, where n = 3 and * p < 0.05 (one-way ANOVA with Tukey’s multiple comparisons test). (G) Transfection evidence of BV2 cells with FAM-conjugated control miRNA, an miR-124 mimic, or miR-124 inhibitor observed using a Zeiss Axio Observer Z1 phase-contrast fluorescent microscope, with scale bars = 100 µm. (B) n = 5. (D) n = 10 and *** p < 0.001 (one-way ANOVA with Tukey’s multiple comparisons test).

