Figure 6.
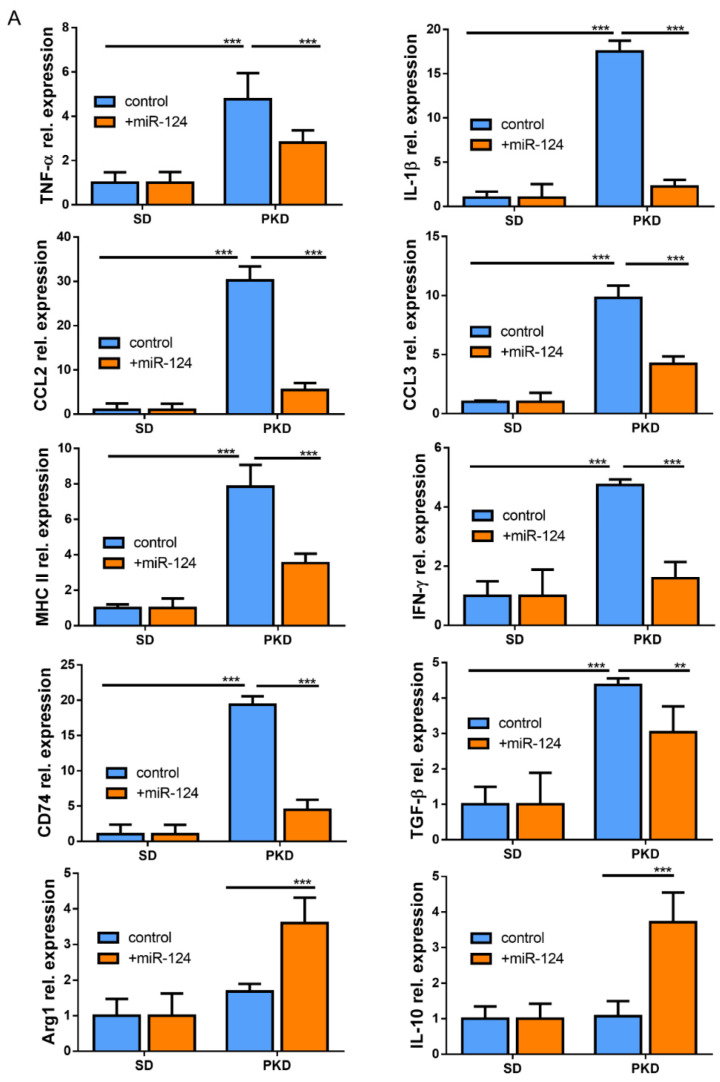
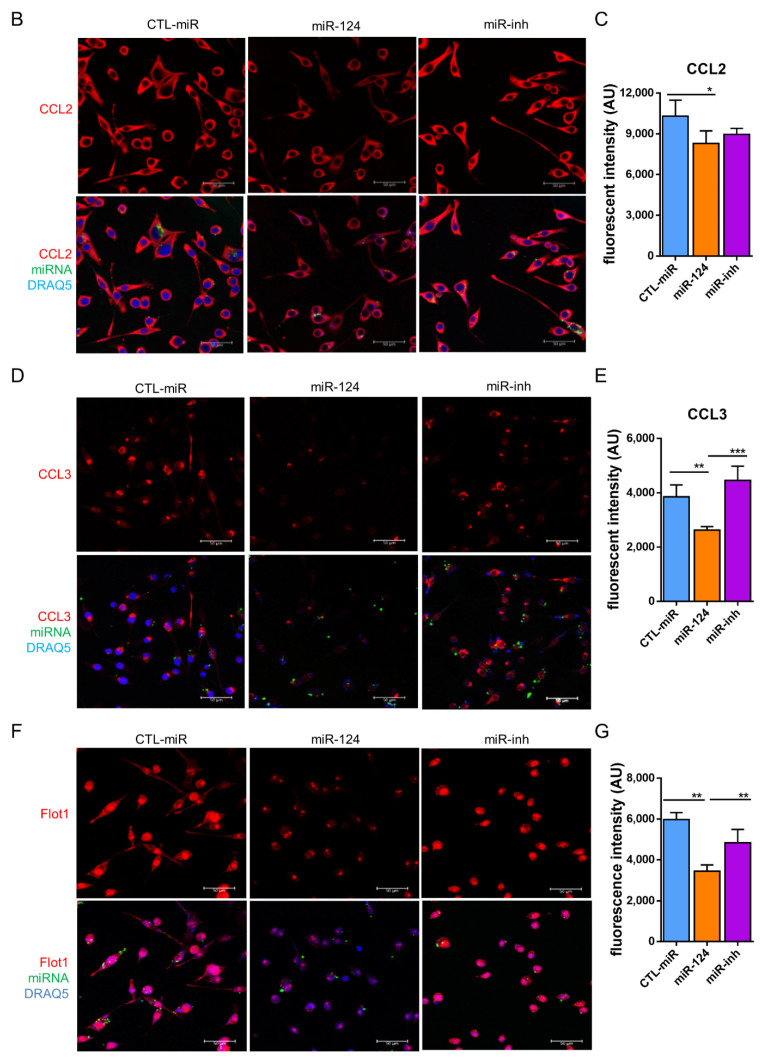
miR-124 reduced expression of pro-inflammatory cytokines in the PKD rat. (A) Quantitative M1 and M2 gene expressions in SD and PKD rats treated with or without the miR-124 mimic. RT-qPCR was performed to evaluate the genes specially expressed in the M1 state (TNF-α, IL-1β, IFN-γ, CCL2, CCL3, MHC-II, CD74, and TGF-β) and M2 state (Arg1 and IL-10). The expression of the house-keeping gene, rat Gapdh, was used as a control. Relative gene expression (fold versus Gapdh) was calculated using the ∆∆CT method. (B,D,F) Representative images of fluorescent immunocytochemistry (ICC) of CCL2 (B), CCL3 (D), and Flot1 (F) in BV2 cells. BV2 cells were transfected with FAM-labeled miR-124 or an miR-124 inhibitor (miR-inh) (green) for 24 h. Antibodies of CCL2, CCL3, and Flot1 were labeled with Alexa Fluor 555 (red), and the nuclei were labeled with DRAQ5TM (blue). Images were taken using a Leica confocal microscope TCS SP8, with scale bars = 50 µm. (C,E,G) Quantification of CCL2 (C), CCL3 (E), and Flot1 (G) expressions from ICC fluorescence intensity using Image J software. Data are shown in arbitrary units (AU). (A,C,E,G) n = 5, * p < 0.05, ** p < 0.01, and *** p < 0.001 (two-way ANOVA with Tukey’s multiple comparisons test).


