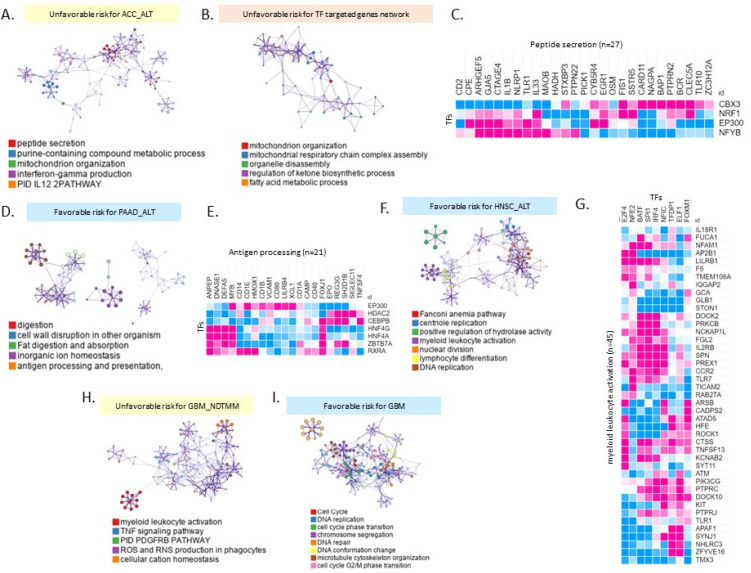
Figure 4.
Visualized enrichment networks of gene ontology analysis of good/poor prognosis specific mRNA expression. (A) Gene ontology analysis of unfavorable risk for the differentially expressed genes (DEGs) between the good patient outcome group and poor patient outcome group in ACC with ALT. (B) TF targeted gene network in unfavorable risk ACC with ALT. Top 5 enriched pathways showing significant difference (FDR = 0.001). (C) Heatmap of correlation value between peptide secretion signature genes (n = 27) and transcriptional factors (CBX3, NRF1, EP300, and NFYB) (pink: positive correlation, blue: negative correlation). (D) Gene ontology analysis of favorable risk of PAAD with ALT. (E) Heatmap of correlation matrix between antigen processing (n = 21) and transcriptional factors (EP300, HDAC2, CEBPB, HIF4G, HIF4A, ZBTB7A, and RXRA). (F) Gene ontology analysis of favorable risk of HNSC with ALT. (G) Heatmap of correlation matrix between myeloid leukocyte activation (n = 45) and transcriptional factors (E2F4, NFE2, BATF, SPI1, NFIC, TFDP1, ELF1, and FOXM1). (H) Gene ontology analysis of unfavorable risk of GBM with NDTMM. (I) Gene ontology analysis of favorable risk GBM with ALT.

