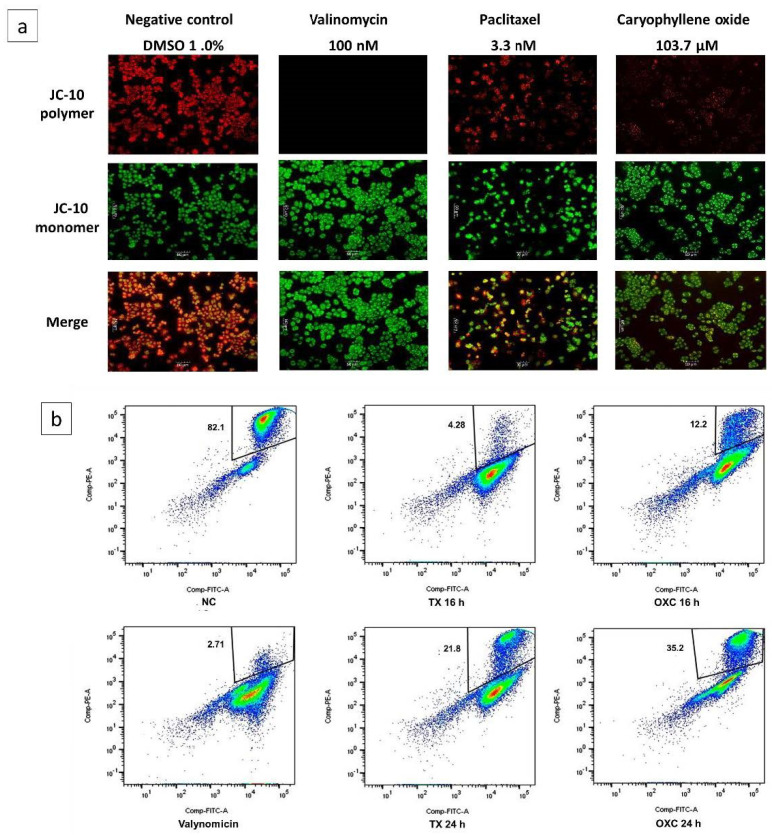
Figure 6.
Loss of the membrane potential (Δψm) in PC-3 cells induced by OXC and Paclitaxel (TX). (a) Immunofluorescence micrographs show the distribution of JC-10 aggregates in the mitochondrial membrane (in red) or monomers in the cytoplasm (in green) on PC-3 cancer cells after 16 h of incubation at the IC50 value, cells treated with 1% DMSO are considered as a negative control (NC). (b) Flow cytometry representative density plots evidencing the loss of mitochondrial membrane potential at 16 and 24 h after OXC treatment. Valinomycin was used as a positive control at 100 nM and evaluated at 2 h. The percentage of polarized cells are shown in the box.

