Figure 4.
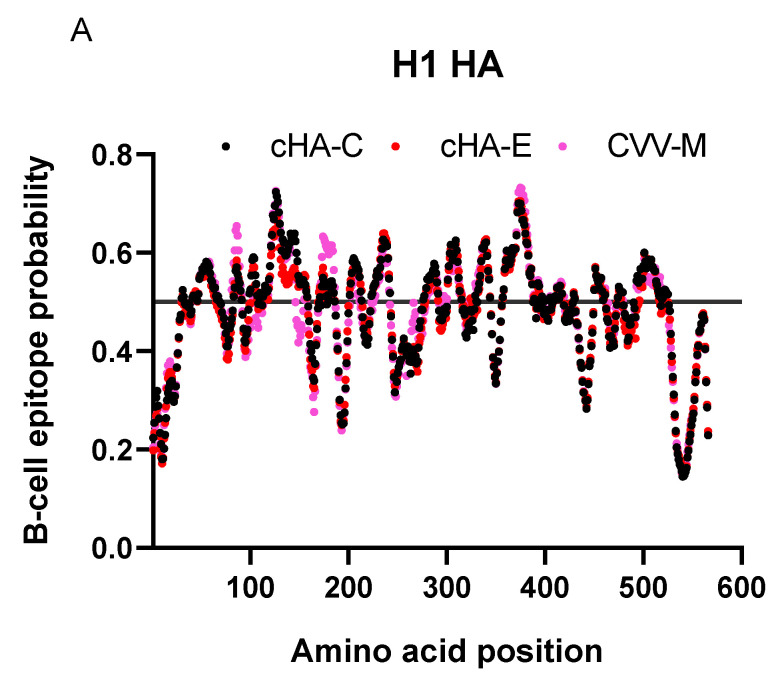
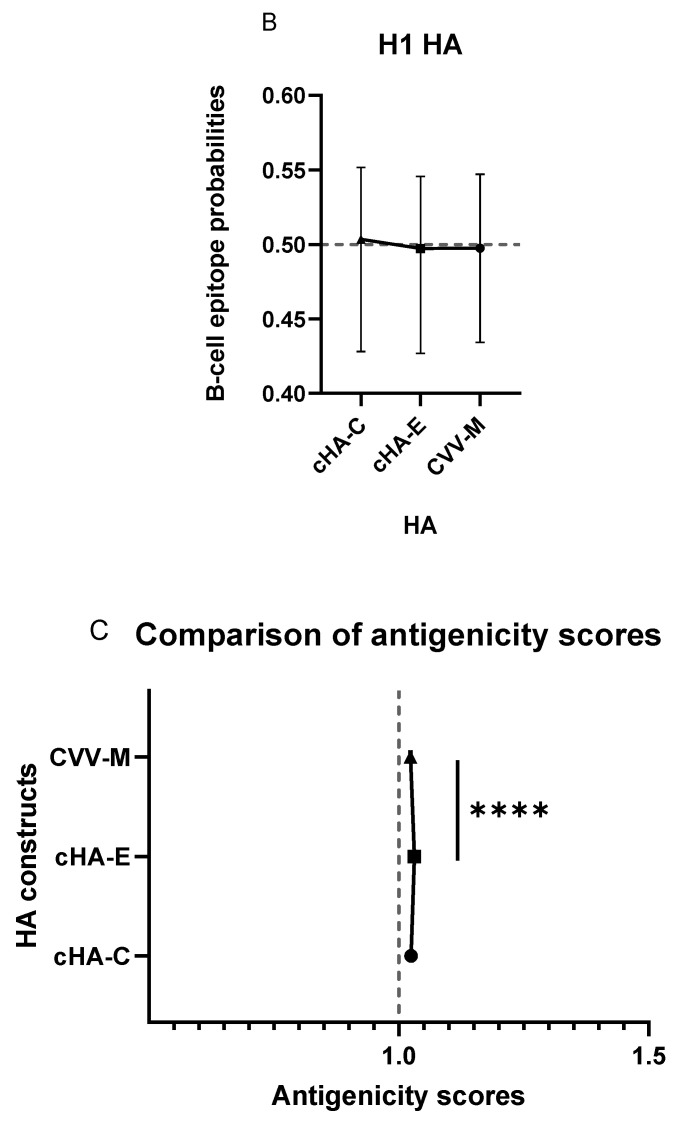
B-cell epitopes and antigenicity predictions on the H1 HAs. Here are charts describing B-cell epitope probabilities and antigenicity scores of the H1 HAs. (A) displays the distributions of the probable epitopes over the default threshold of 0.5; (B) represents the comparison of the medians of the B-cell epitope probability scores, using the Kruskal–Wallis test; (C) displays the antigenicity of the HAs given a default threshold of 1.000 antigenicity score: Means of the scores were compared using two-way ANOVA and p-values were corrected using Dunnett’s multiple comparisons test p < 0.0005: ****.


