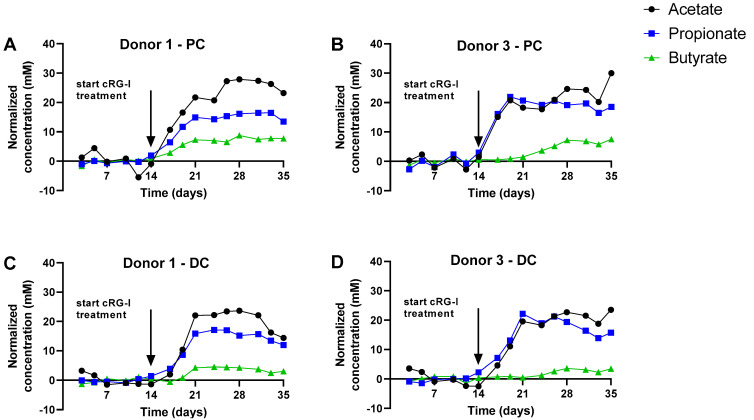
Figure 3.
Effect of fermentation of cRG-I on SCFA production in the simulated proximal and distal colon during both the control (Days 0–14) and treatment period (Days 14–35) of the quad-M-SHIME for Donors 1 (panels A and C) and 3 (panels B and D). Data are expressed as normalized values versus the average of the control period. Donor A and C results are representative of those obtained for Donors B and D, respectively (see Supplementary Figure S1). Arrows indicate the start of the cRG-I treatment. cRG-I = carrot-derived Rhamnogalacturonan I, DC = distal colon, PC = proximal colon. The absolute values on which the normalized concentrations are based are shown in Figure S2 panels A/C/E/G.

