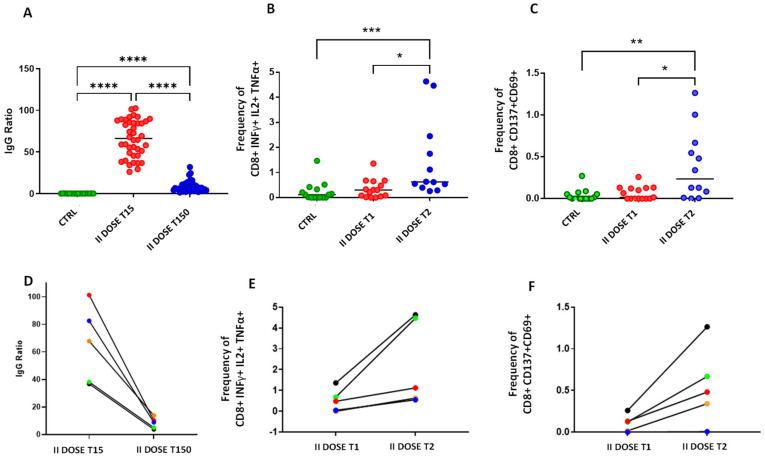
Figure 1.
Panel (A): Levels of anti-SARS-CoV-2 IgG measured in: A control group that was not infected or vaccinated (CTRL, green dots); in a group of vaccinated subjects 15 and 150 days after the second dose of BNT162b2 (respectively: red dots, II DOSE T15 and blue dots II DOSE T150). Panels (B,C): Frequencies of S-specific CD8+ cells producing cytokines (INFγ+ IL2+ TNFα+ in Panel (B) and CD137+CD69+ in Panel (C)) are shown in SARS-CoV-2 unexposed healthy donors who never received any anti-SARS-CoV-2 vaccine (CTRL), in vaccinated donors analyzed between 0 and 2 months after the second dose (red, II DOSE T1), and between 3 and 5 months after the second dose (blue II DOSE T2). Individual data points are represented as scatter dot plots with lines showing the median value. Panel (D): IgG anti-SARS-CoV-2 levels measured in five vaccinated donors after 15 and 150 days after the second dose of BNT162b2 vaccine. Panel (E): Frequency trend of S-specific CD8+ T-cells INFγ, IL2, and TNFα positive in the five donors vaccinated subjected: thirthy days after the seconds dose (II DOSE T1) and approximately 100 days after the second dose (II DOSE T2). Panel (F): Frequency trend of S-specific CD8+, CD137+, and CD69+ T-cells. * indicates p value < 0.05, ** indicates p value < 0.01, *** indicates p value < 0.001, **** indicates p value < 0.0001.

