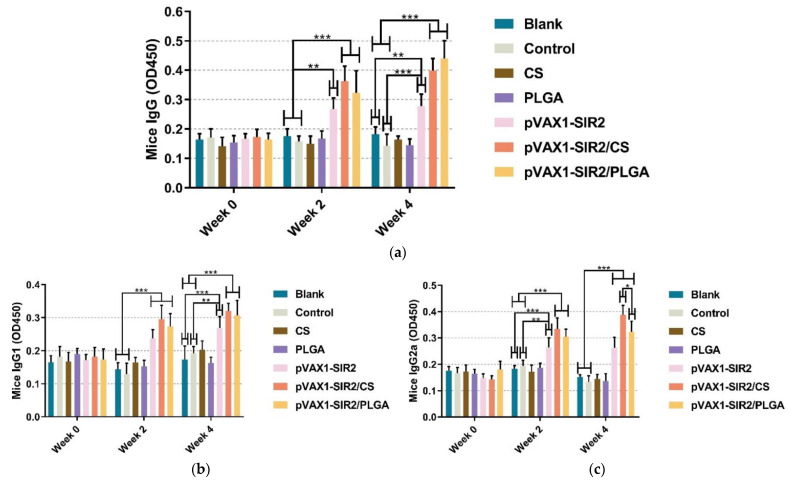
Figure 5.
Secretions of IgG (a), isotypes IgG1 (b), and IgG2a (c) in the sera separated from immunized animals at week zero, two, and four. The dilution ratio of tested sera was 1:100 in ELISA analysis, and each serum was investigated once. Values were analyzed by one-way ANOVA analysis followed by Dunnett’s test. Values between the pVAX1-SIR2/CS and pVAX1-SIR2/PLGA group were estimated by the independent t-test. Values were shown as mean of OD450 ± SD (n = 5). * p < 0.05, ** p < 0.01, and *** p < 0.001 compared with blank or control group.

