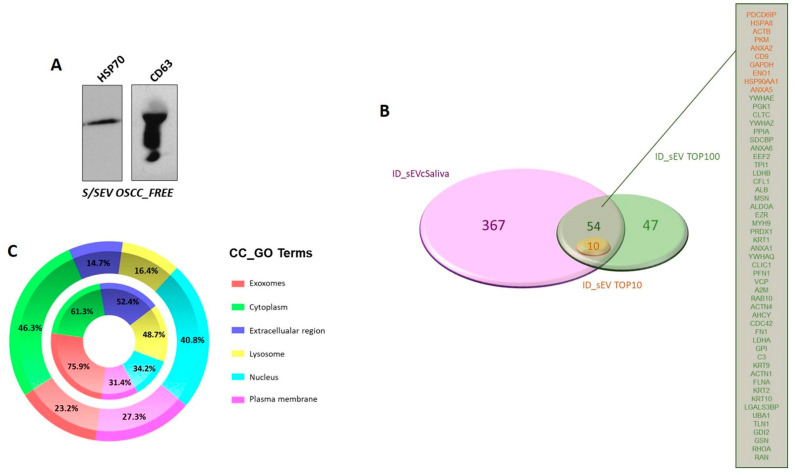
Figure 3.
(A) Western blot revealing the presence of EV markers in representative in S/SEV OSCC_FREE pooled samples. (B) Venn diagram created using the stand-alone enrichment analysis tool FunRich (http://www.funrich.org, accessed on 22 September 2021) showing that among the proteins identified in S/SEV, there were all the TOP10 and more than 50% of the TOP100 EV proteins. (C) Percentage distribution of exosome/nanovesicle proteins reported in Vesiclepedia dataset (outer chart) and of the S/SEV proteins (inner chart) within the “Cellular Component” (CC) GO term. The top 6 represented CC_GO terms are reported. The analysis was performed using FunRich.

