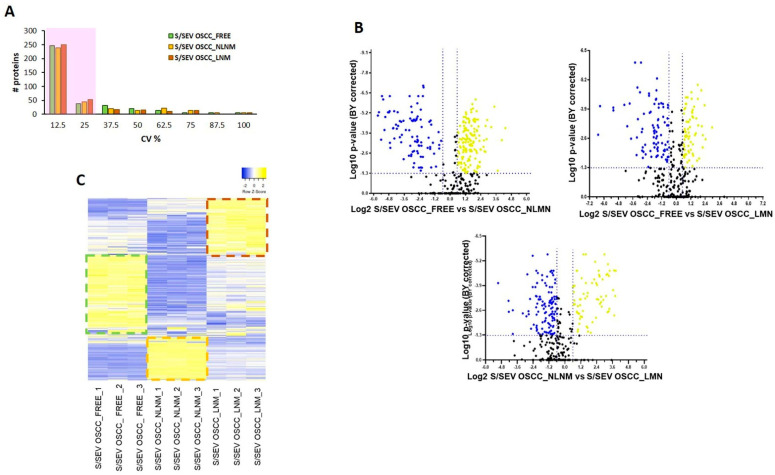
Figure 4.
(A) Histogram shows the distribution of coefficients of variation (CV) among technical replicates of S/SEV OSCC_FREE, S/SEV OSCC_NLNM, and S/SEV OSCC_LNM. About 80% of the proteins have CV ≤ 25% (shadow area). (B) Volcano plot of the log2 fold change (x-axis) versus the -log10 BH corrected p-value (y-axis) of the 365 quantified proteins. The dashed lines correspond to 1.5-fold up and down (vertical lines), and a BY corrected p-value of 0.05 (horizontal line). In the plots, the yellow dots represent the proteins significantly up-represented and the blue ones the proteins significantly down-represented in the comparison indicated in the x-axis. (C) Heat map representing color-coded expression levels of proteins quantified in the three replicates of each group of pooled S/SEVs: yellow indicates high expression values and blue indicates low expression values. Details of regulated genes are provided in Supplementary Table S2.

