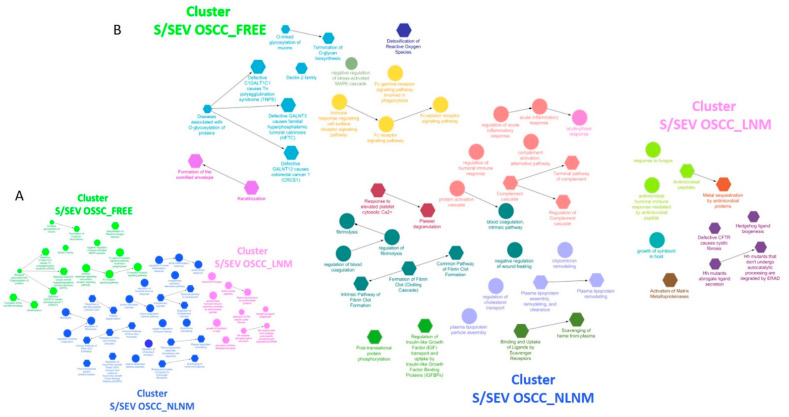
Figure 5.
(A) ClueGo analysis of the proteins up-represented in each of the three S/SEV subtypes highlighting different clusters of enriched functional network terms (Adj p-value < 0.05); (B) within each identified cluster, the terms/nodes with the same color form a GO functional groups (see for details Figure 6). Within the clusters, each node represents a term of “biological process” (circle) or a Reactome pathway (hexagon), and the arrows represent direct relations between the nodes. Nodes are specifically related to a cluster when at least the 75% of the proteins of the node belong to that cluster.

