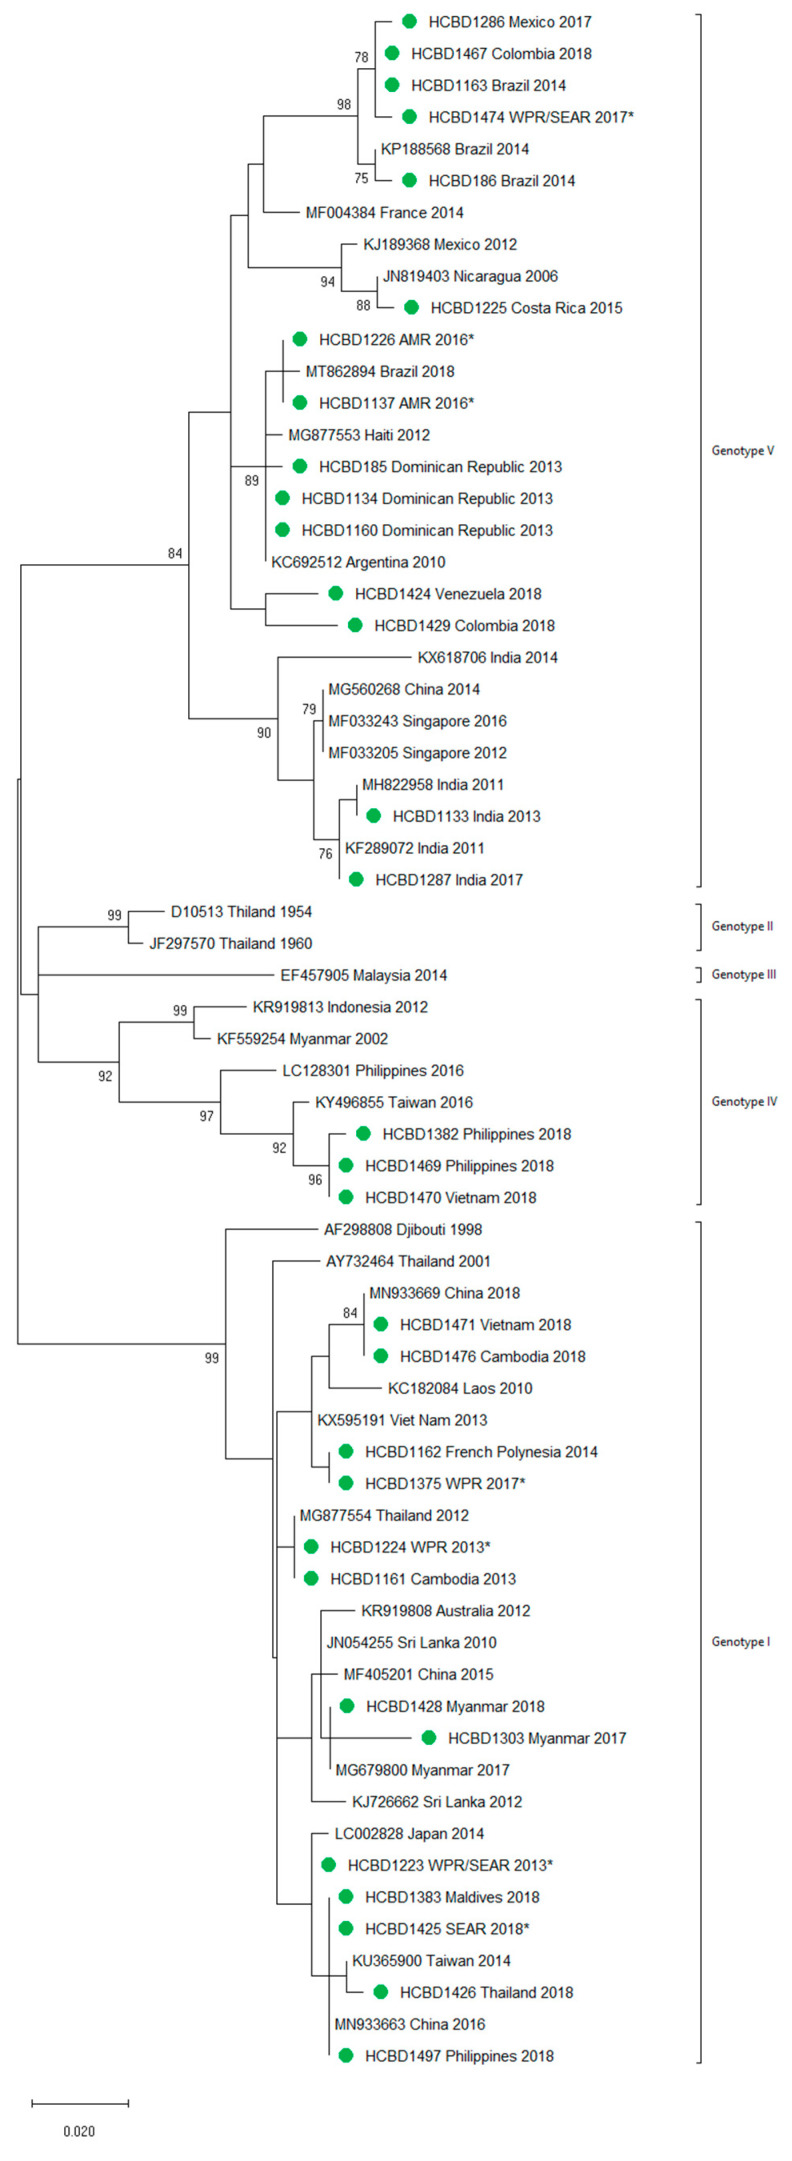
Figure 3.
Phylogenetic tree of DENV-1 strains based on the E/NS1 junction region. Strains are denoted by the GenBank accession number, place and year of isolation. The green dots indicate the strains sequenced in this study and the scale bar indicates substitutions per site. The analysis was performed using the maximum likelihood method (K2 + G) with a bootstrap of 1000 replicates.

