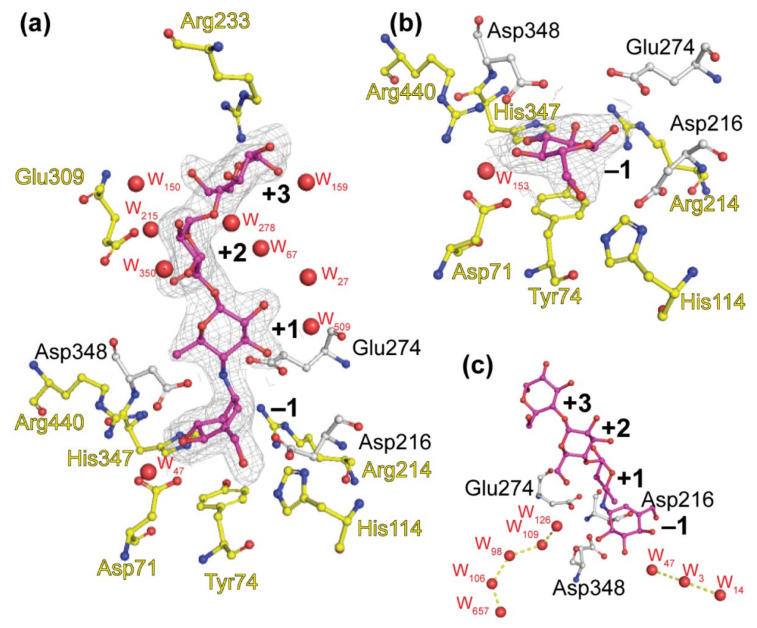
Figure 4.
Binding of α-acarbose (a) and D-glucose (b) to the active center of the maltase BaAG2. Water chains reaching the active center on BaAG2-acarbose structure are shown on panel (c). Catalytic triad (Asp216, Glu274, and Asp348) residues are in grey, amino acids contributing to ligand binding are shown in yellow, and water molecules (W) are shown as red spheres. Acarbose and glucose are colored in magenta and final 2Fo-Fc electron density contoured at 1 σ. Binding subsites of acarbose are designated with bold numbers. Structures were visualized with PyMol [39].

