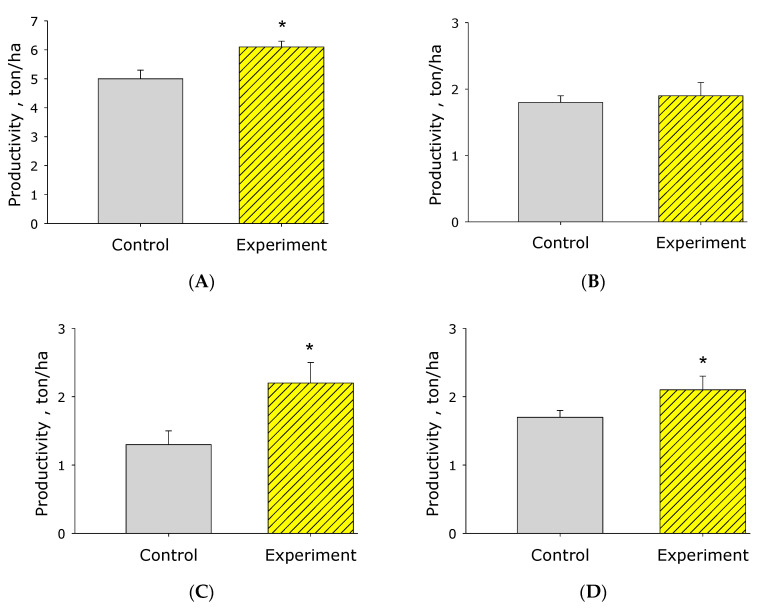
Figure 4.
Histogram of the main results of the analysis of sheaves of biomass of grain sorghum “Eltonskoye” soaked in activated water (Experiment) and control water (Control). (A)—terrestrial biomass, ton/hectare; (B)—biomass of stubble 15 cm high, ton/hectare; (C)—hay biomass, ton/hectare; (D)—biomass of grain, ton/hectare. *—statistical differences relative to control (p < 0.05).

