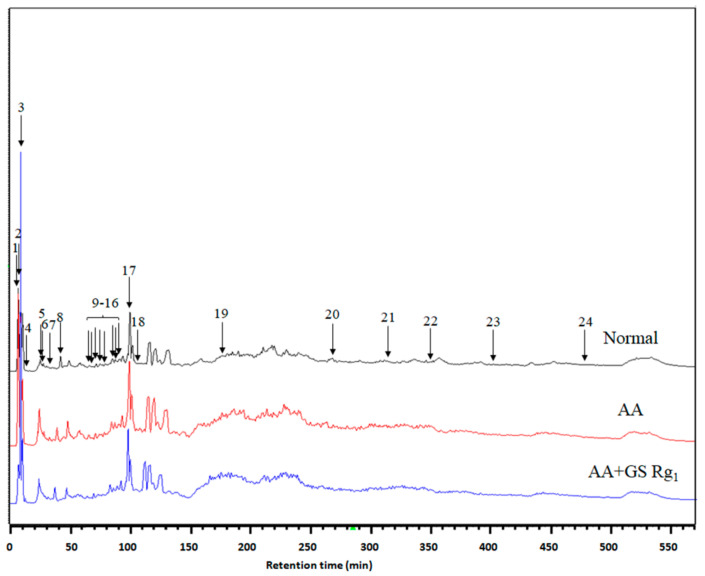
Figure 2.
Chromatogram of FD-LC/MS/MS. Renal homogenates were analyzed using FD-LC-MS/MS. After separation, 24 peaks were found to be significantly different. PLS-DA separated protein according to classification. (a) Red: normal. Green: AA group. Blue: AA + Rg1 group. The score plot shows good separation. (b) Some observations were apparently discriminated in the loading plot. Abbreviations: AA, aristolochic acid; GS, ginsenosides.

