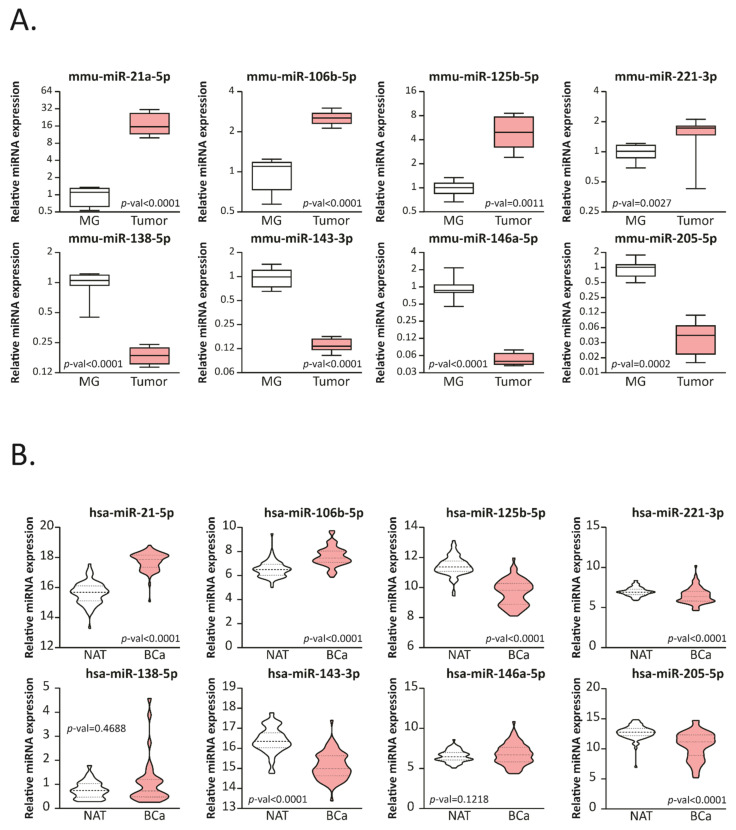
Figure 1.
miRNAs expression is modulated in BCa mice and human samples. (A) Stem-loop RT-qPCR from 4T1 allografts (Tumor) or mammary-glands (MG) Balb/c mice using specific primers for the indicated miRNAs is shown (n = 8 per group; primers were run in duplicates). The data were normalized to mmu-miR-191-5p and MG. Statistical analysis was performed using a T-test, Welch or sing-median test when appropriate. (B) Expression levels of the corresponding miRNAs in BCa tumors paired normal adjacent tissue (NAT) from the TCGA-BRCA dataset are graphed in read per millions. The name of the miRNAs is indicated up each plot in bold. Statistical analysis was performed using a paired T-test or Wilcoxon test when appropriate.

