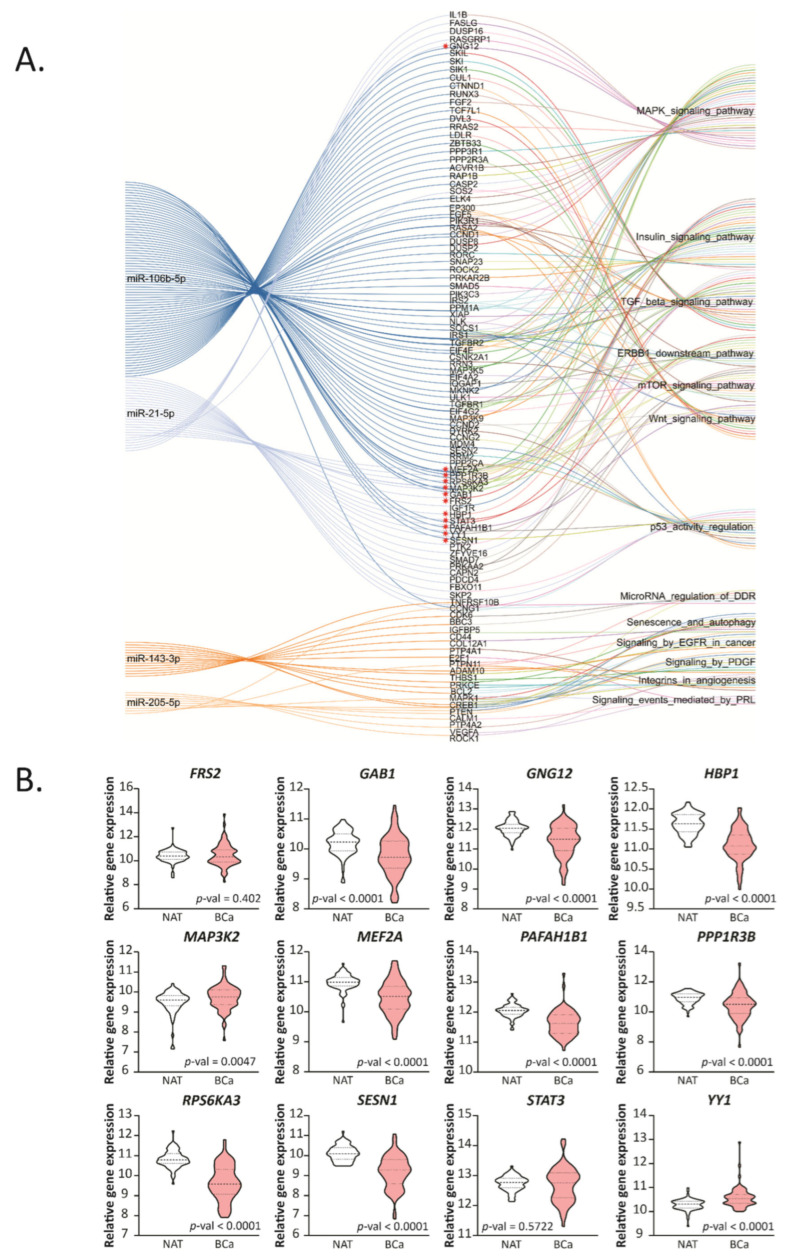
Figure 4.
Functional enrichment of validated miRNA targets and their expression in human samples. (A) String diagram performed based on the top five significant KEGG pathways associated to the target genes of the up- and down-regulated miRNAs in common between humans and mice. Relevant genes related to the up-regulated miRNAs are marked with a red asterisk. (B) Expression levels of the selected genes in BCa tissue paired with normal adjacent tissue (NAT) from the TCGA-BRCA dataset are graphed in read per millions. The name of the genes is indicated up each plot in bold. Statistical analysis was performed using paired T-test or Wilcoxon test when corresponded.

