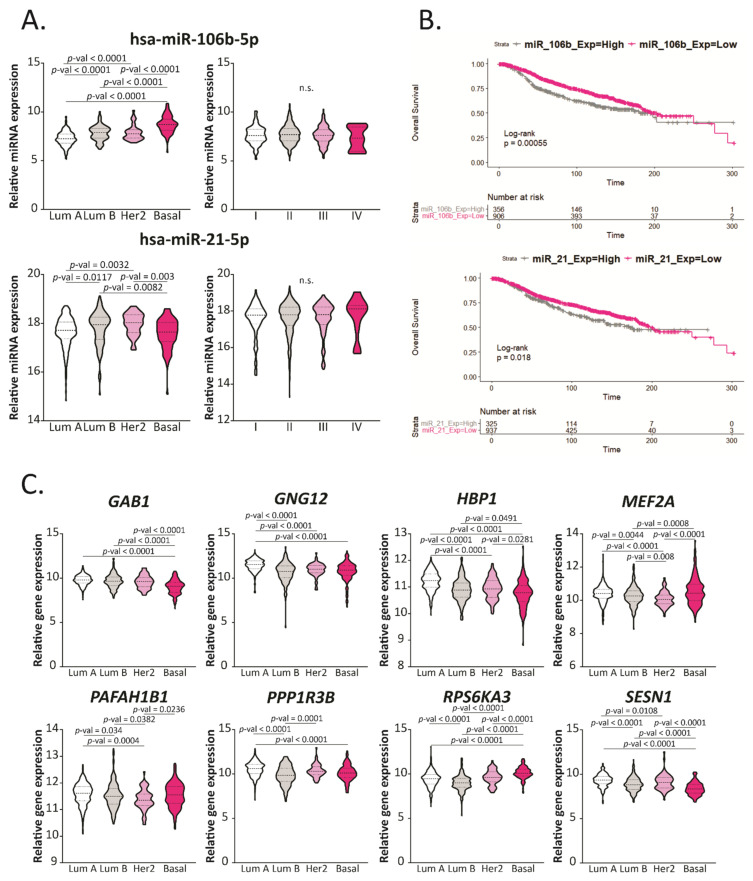
Figure 5.
Hsa-miR-106b-5p, miR-21-5p and their target genes are deregulated in aggressive BCa subtypes and correlate with overall survival. (A) Expression levels of hsa-miR-106b-5p and miR-21-5p in BCa tissue divided in subtypes (Luminal A, Luminal B, Her2 or Basal) or Stages (I to IV) from the TCGA-BRCA dataset are graphed in read per millions. The name of the miRNAs is indicated up each plot in bold. Statistical analysis was performed using One-Way ANOVA or Kruskal–Wallis test followed by Tukey or Dunn’s, respectively, when corresponded. (B) Kaplan–Meier curves comparing the overall survival (OS) between BCa patients with high or low expression of hsa-miR-106b-5p or miR-21-5p, respectively, in tumors. Statistical analysis was performed using the Cox–Mantel test. (C) Expression levels of the mentioned genes in BCa tissue divided in subtypes (Luminal A, Luminal B, Her2 or Basal) from the TCGA-BRCA dataset are graphed in read per millions. The name of the miRNAs is indicated up each plot in bold. Statistical analysis was performed using One-Way ANOVA or the Kruskal–Wallis test followed by Tukey or Dunn’s, respectively, when corresponded.

